Portal Reports Page
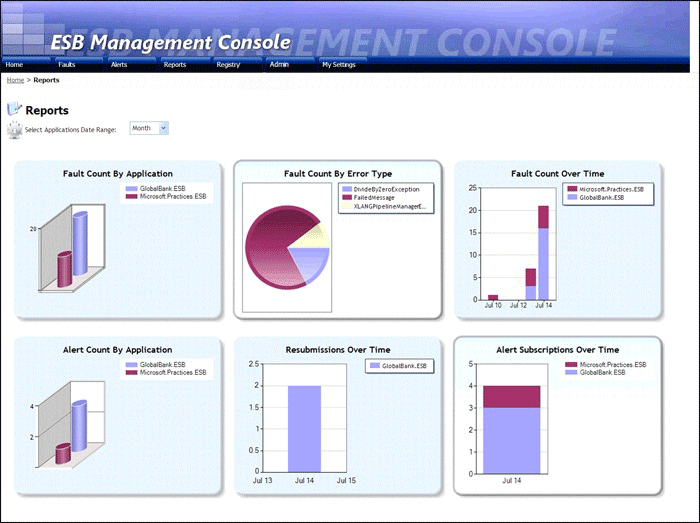
The Portal Reports page, shown in Figure 1, displays the following charts:
Fault Count By Application. This option displays an aggregate view of all the faults generated for a specified set of applications over a specified time.
Fault Count By Error Type. This option displays an aggregate view of all faults by specified error type generated for a specified set of applications over a specified time.
Fault Count Over Time. This option displays a count of faults over a specified period for a specified set of applications. You can select an application to display a trend chart showing the number of faults over time for specific services within the application.
Alert Count By Application. This option displays an aggregate view of all the alerts generated for a specified set of applications over a specified time.
Resubmissions Over Time. This option displays a count of failed message resubmissions over a specified period for a specified set of applications.
Alert Subscriptions Over Time. This option displays a count of alert subscriptions over a specified period for a specified set of applications.

Figure 1
The ESB Management Portal Reports page
The following list explains how you can use the features of the ESB Management Portal New Registry Entry page:
Click the SelectApplications link above the first chart, and then select or clear the check boxes in the list of installed Microsoft BizTalk Server applications that appears. You can also use the links that appear to select all or none of the applications. Click Save to show the information for the selected applications, or click Cancel to abandon your changes.
Use the drop-down list above the first chart to select the interval over which you want the charts to show data. You can choose to include data for the previous Hour, Day, Week, Month, Quarter, Year, or ALL.
Click one of the charts in the page to show a breakdown of the data by service within the application. Depending on the chart you select, this shows a count or trend line for the individual faults, alerts, error types, resubmissions, or alert subscriptions for each service.
Click the name of a service in this chart to display a table listing all the faults, alerts, error types, resubmissions, or alert subscriptions for the selected service.
Click Export To Excel to download the list of subscriptions in a format that you can view in Microsoft Excel.