Debugging with the logical job diagram (preview) in Azure portal
The job diagram (physical diagram and logical diagram) in the Azure portal can help you visualize your job's query steps with its input source, output destination, and metrics. You can use the job diagram to examine the metrics for each step and quickly identify the source of a problem when you troubleshoot issues.
This article describes how to use the logical job diagram to analyze and troubleshoot your job in Azure portal.
The logical job diagram is also available in Stream Analytics extension for VS Code. It provides the similar functions with more metrics when you debug your job that runs locally on your device. To learn more, see Debug Azure Stream Analytics queries locally using job diagram.
Use the logical job diagram
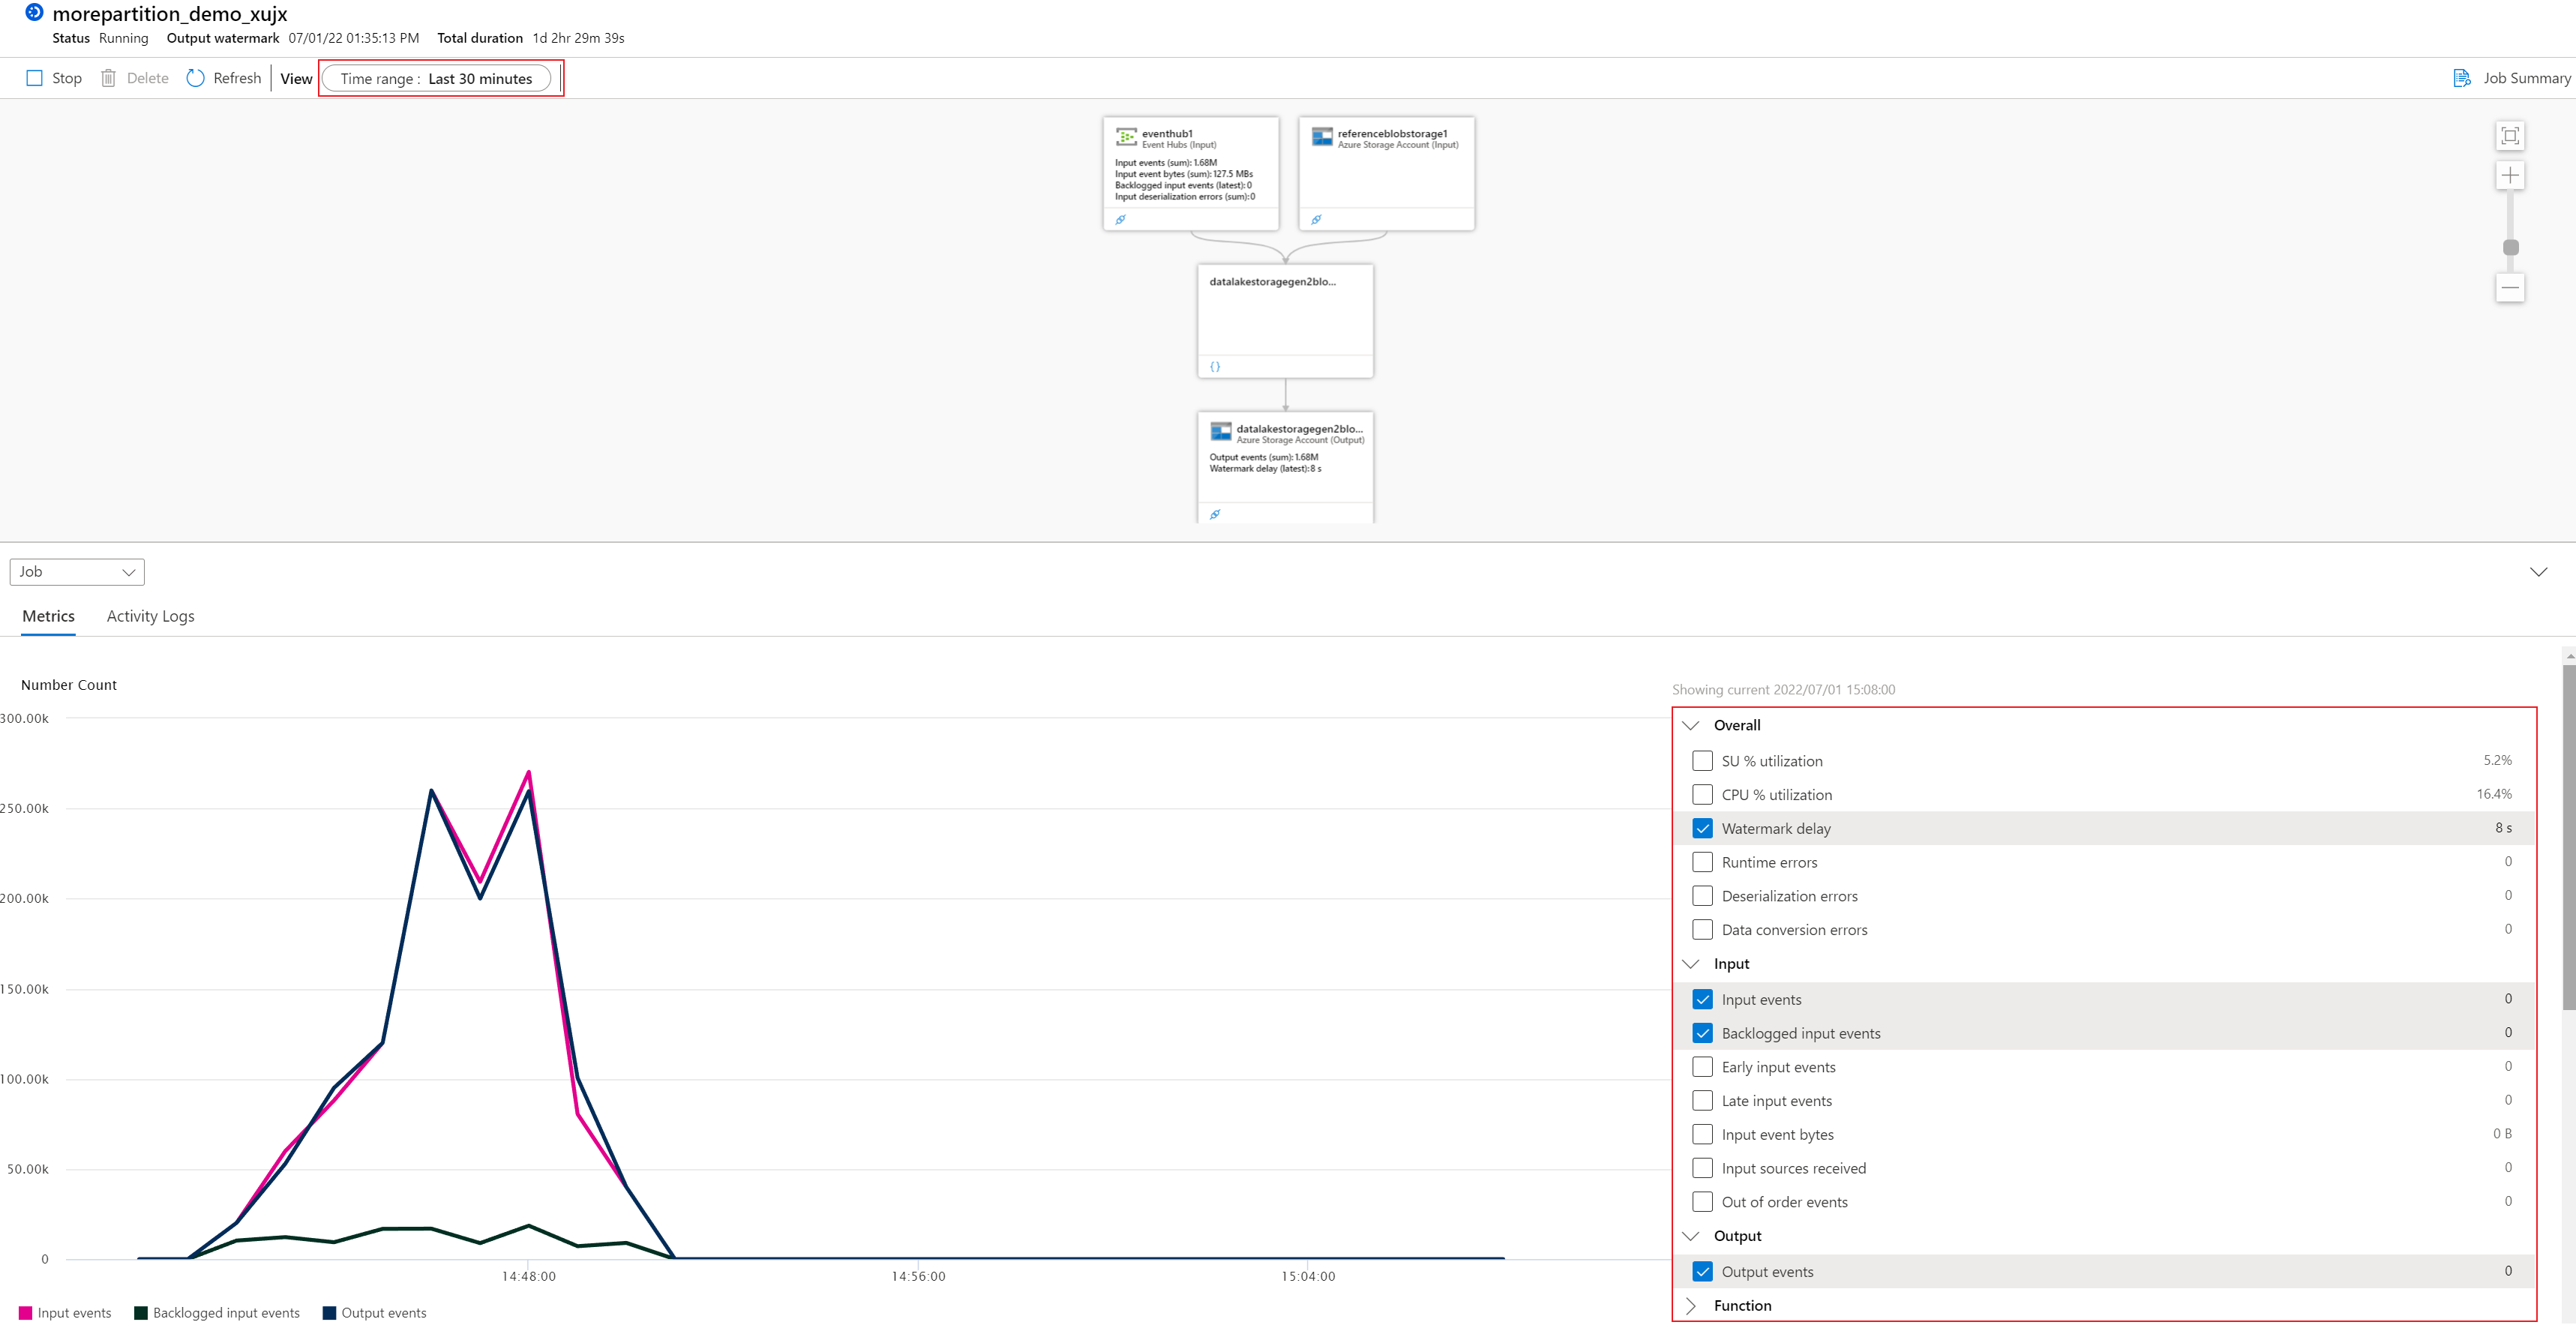
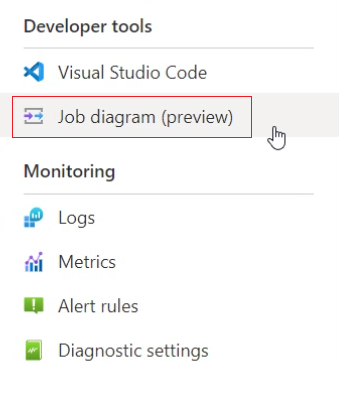
In the Azure portal, locate and select a Stream Analytics job. Then select Job diagram (preview) under Developer tools:
The job level default metrics such as Watermark delay, Input events, Output Events, and Backlogged Input Events are shown in the chart section for the latest 30 minutes. You can visualize other metrics in a chart by selecting them in the left pane.
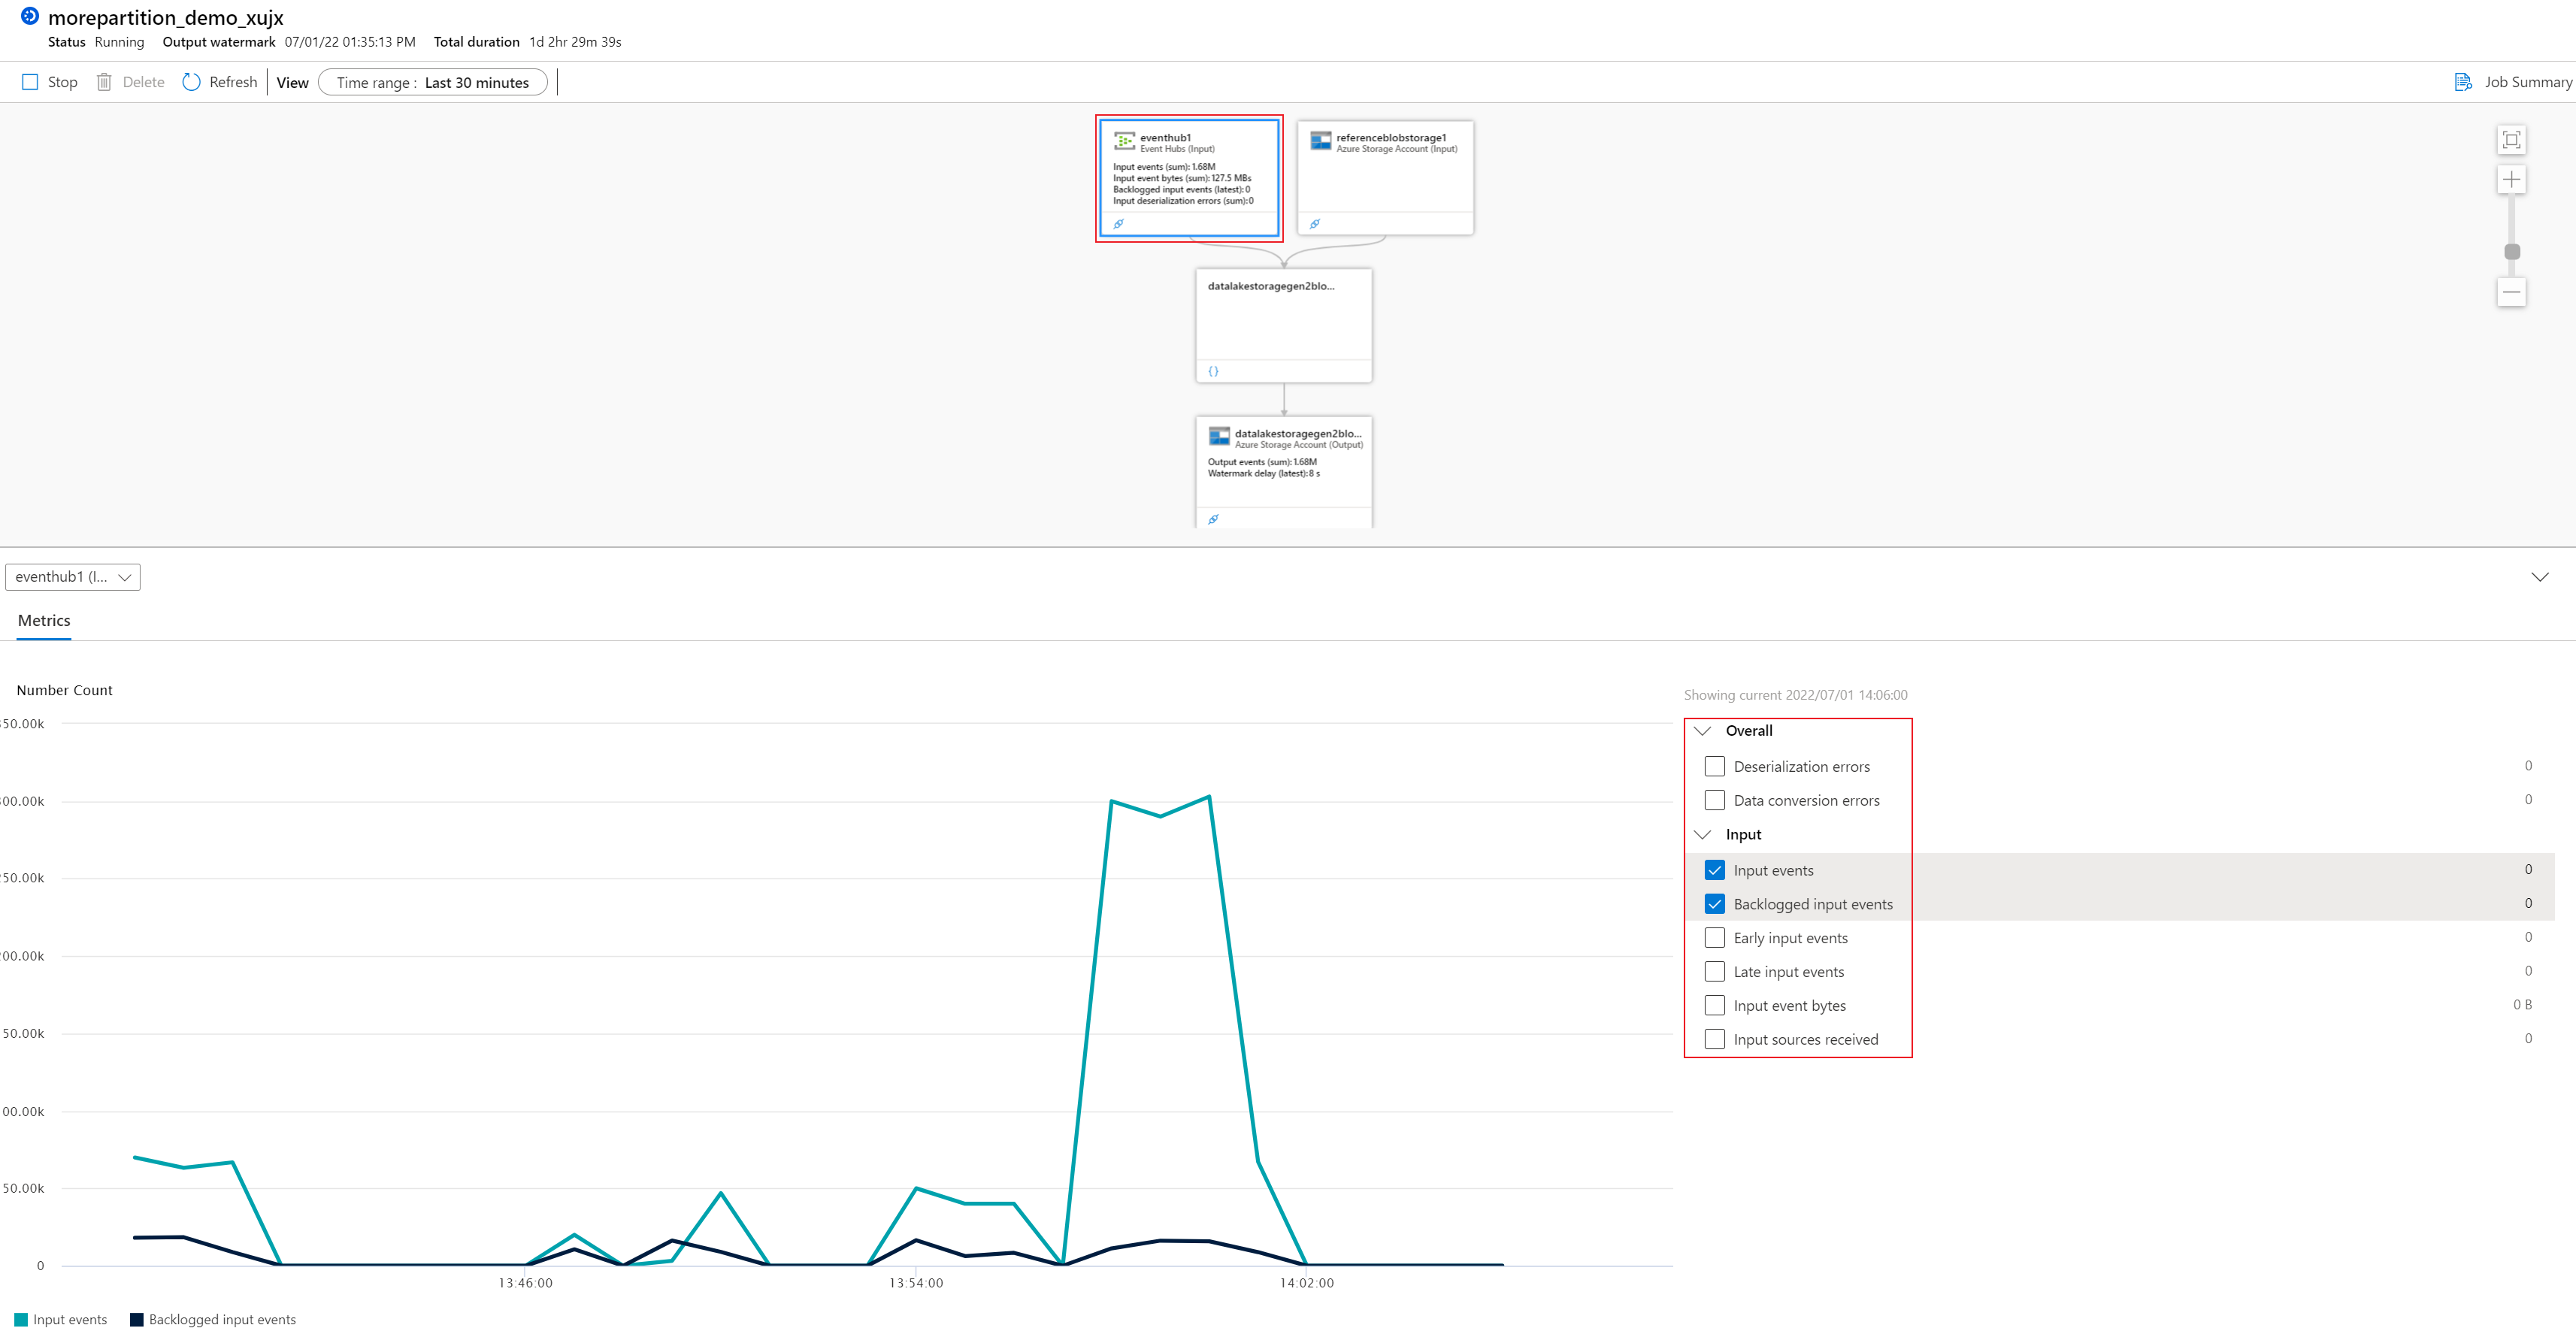
If you select one of the nodes in diagram section, the metrics data and the metrics options in the chart section will be filtered according to the selected node's properties. For example, if you select the input node, only the input node related metrics and its options are shown:
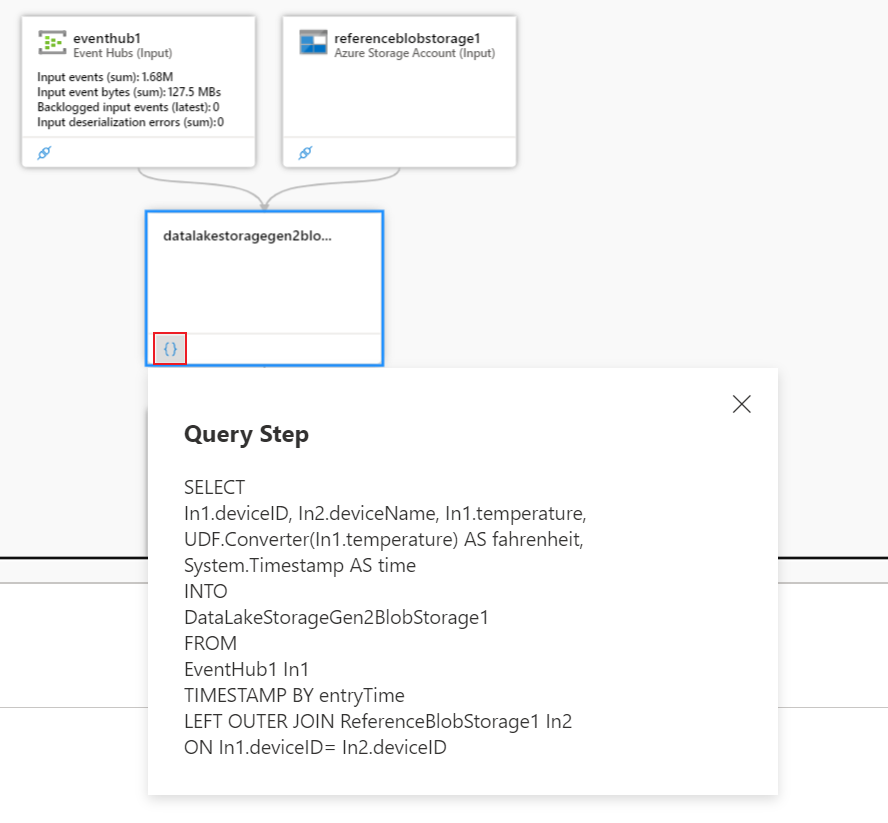
To see the query script snippet that is mapping the corresponding query step, select the {}' icon in the query step node as shown below:
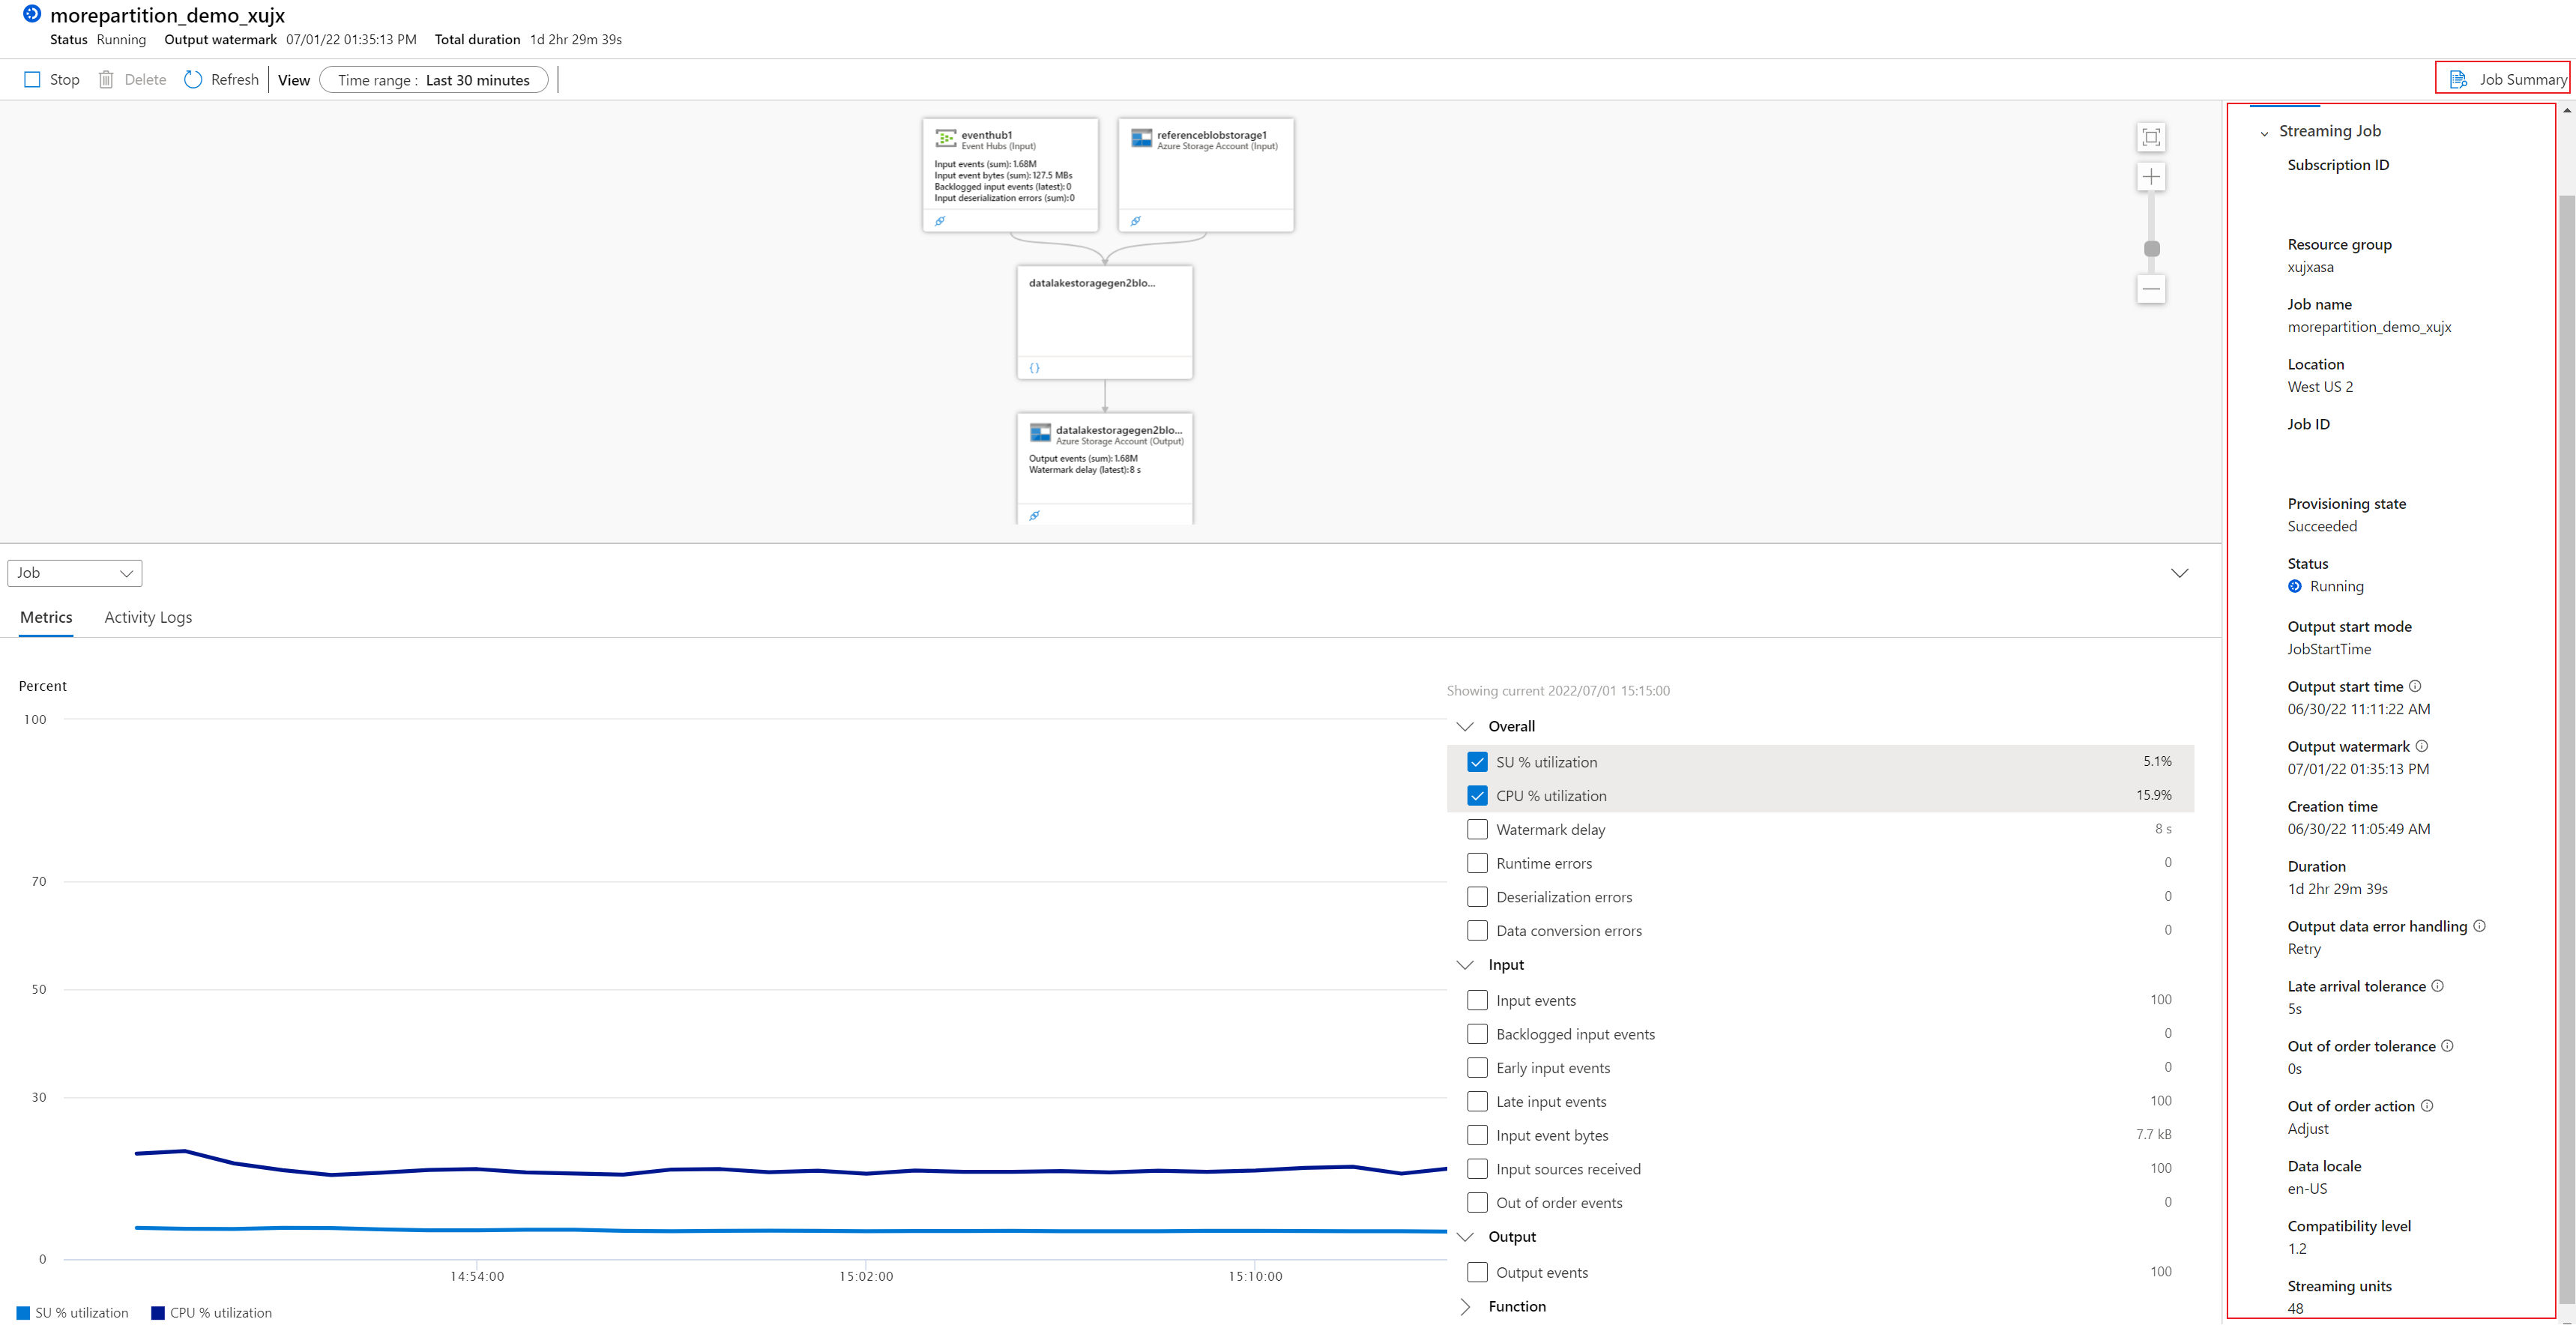
To see the job overview information summary, select the Job Summary button on the right side.
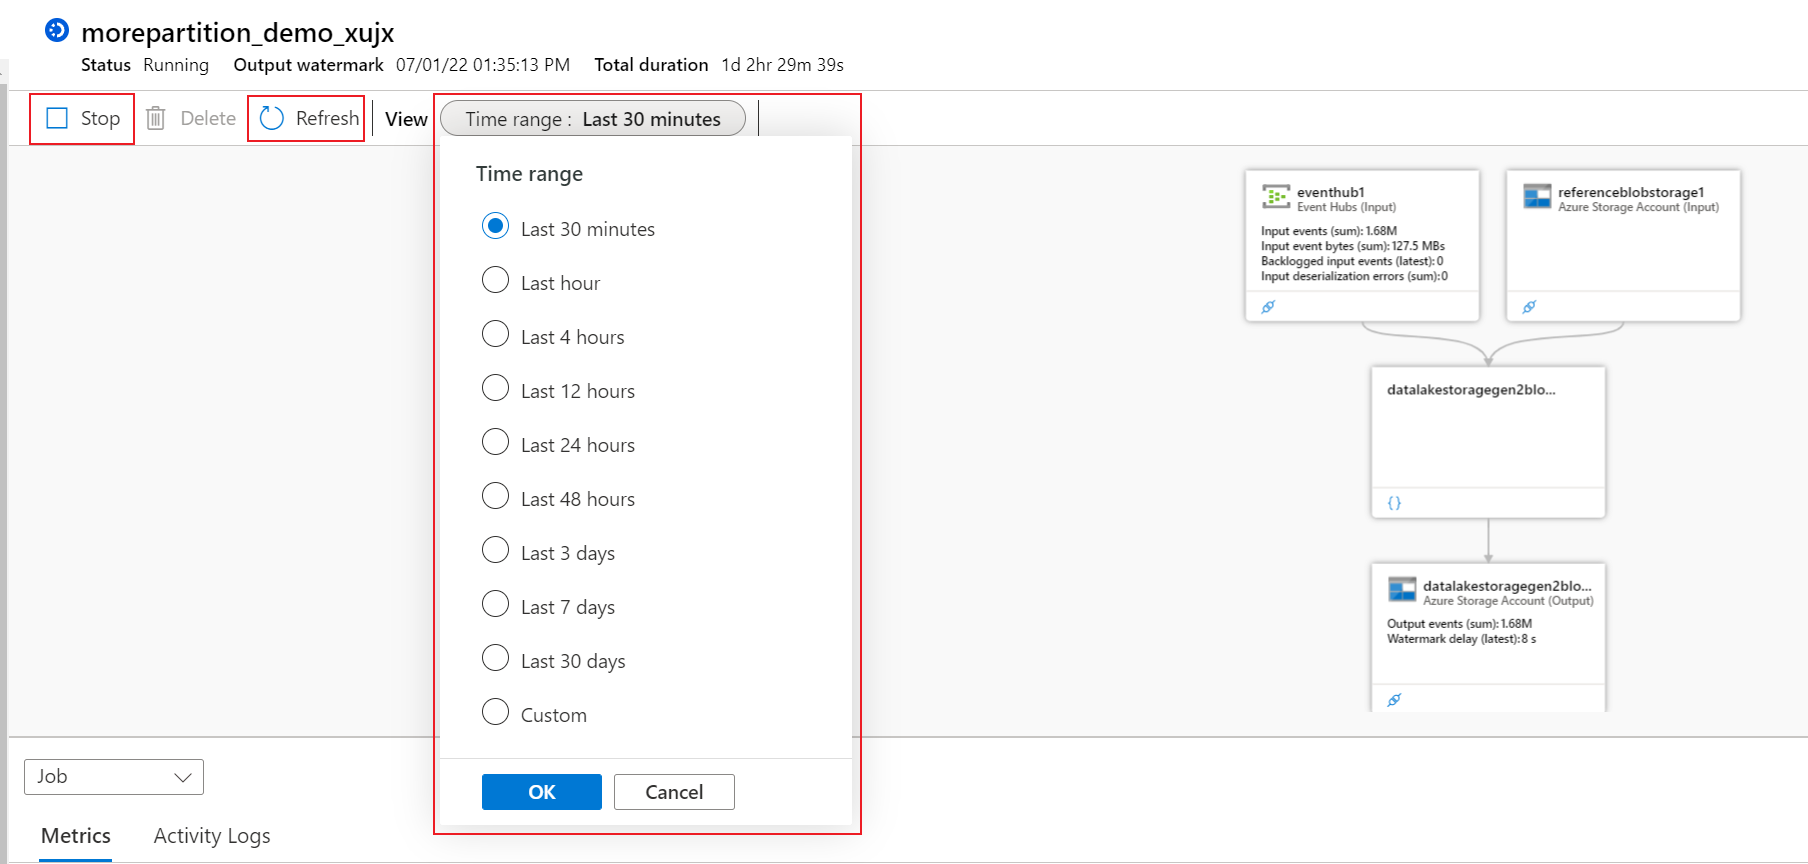
It also provides the job operation actions in the menu section. You can use them to stop the job (Stop button), refresh the metrics data (Refresh button), and change the metrics time range (Time range).
Troubleshoot with metrics
A job's metrics provides lots of insights to your job's health. You can view these metrics through the job diagram in its chart section in job level or in the step level. To learn about Stream Analytics job metrics definition, see Azure Stream Analytics job metrics. Job diagram integrates these metrics into the query steps (diagram). You can use these metrics within steps to monitor and analyze your job.
Is the job running well with its computation resource?
- SU (Memory) % utilization is the percentage of memory utilized by your job. If SU (Memory) % utilization is consistently over 80%, it shows the job is approaching to the maximum allocated memory.
- CPU % utilization is the percentage of CPU utilized by your job. There might be spikes intermittently for this metric. Thus, we often check its average percentage data. High CPU utilization indicates that there might be CPU bottleneck when the number of backlogged input events or watermark delay increases at the same time.
How much data is being read?
The input data related metrics can be viewed under Input category in the chart section. They're available in the step of the input.
- Input events is the number of data events read.
- Input events bytes is the number of event bytes read. It can be used to validate that events are being sent to the input source.
- Input source received is the number of messages read by the job.
Are there any errors in data processing?
- Deserialization errors is the number of input events that couldn't be deserialized.
- Data conversion errors is the number of output events that couldn't be converted to the expected output schema.
- Runtime errors is the total number of errors related to query processing (excluding errors found while ingesting events or outputting results).
Are there any events out of order that are being dropped or adjusted?
- Out of order events is the number of events received out of order that were either dropped or given an adjusted timestamp, based on the Event Ordering Policy. It can be impacted by the configuration of the "Out of order events" setting under Event ordering section in Azure portal.
Is the job falling behind in processing input data streams?
- Backlogged input events tells you how many more messages from the input need to be processed. When this number is consistently greater than 0, it means your job can't process the data as fast as it's coming in. In this case, you may need to increase the number of Streaming Units and/or make sure your job can be parallelized. You can see more info in the query parallelization page.
Get help
For more assistance, try our Microsoft Q&A question page for Azure Stream Analytics.
