Quickstart: Monitor applications end-to-end
Note
The Basic, Standard, and Enterprise plans entered a retirement period on March 17, 2025. For more information, see the Azure Spring Apps retirement announcement.
The Standard consumption and dedicated plan entered a retirement period on September 30, 2024, with a complete shutdown by the end of March 2025. For more information, see Migrate Azure Spring Apps Standard consumption and dedicated plan to Azure Container Apps.
This article applies to: ❎ Basic/Standard ✅ Enterprise
This quickstart shows you how monitor apps running the Azure Spring Apps Enterprise plan by using Application Insights and Log Analytics.
Note
You can monitor your Spring workloads end-to-end by using any tool and platform of your choice, including App Insights, Log Analytics, New Relic, Dynatrace, AppDynamics, Elastic, or Splunk. For more information, see Working with other monitoring tools later in this article.
Prerequisites
- An Azure account with an active subscription. Create an account for free.
- Understand and fulfill the Requirements section of Enterprise plan in Azure Marketplace.
- The Azure CLI version 2.45.0 or higher.
- Git.
-
The Azure Spring Apps Enterprise plan extension. Use the following command to remove previous versions and install the latest Enterprise plan extension. If you previously installed the
spring-cloudextension, uninstall it to avoid configuration and version mismatches.az extension add --upgrade --name spring az extension remove --name spring-cloud - Resources to monitor, such as the ones created in the following quickstarts:
Update applications
You must manually provide the Application Insights connection string to the Order Service (ASP.NET core) and Cart Service (python) applications. The following instructions describe how to provide this connection string and increase the sampling rate to Application Insights.
Note
Currently only the buildpacks for Java and Node.js applications support Application Insights instrumentation.
Create variables to hold the resource names by using the following commands. Be sure to replace the placeholders with your own values. The name of your Azure Spring Apps service instance must be between 4 and 32 characters long and can contain only lowercase letters, numbers, and hyphens. The first character of the service name must be a letter and the last character must be either a letter or a number.
export RESOURCE_GROUP="<resource-group-name>"
export APP_INSIGHTS_NAME="<app-insights-name>"
export KEY_VAULT_NAME="<key-vault-name>"
export AZURE_SPRING_APPS_SERVICE_INSTANCE_NAME="<Azure-Spring-Apps-service-instance-name>"
Note
By default, the APP_INSIGHTS_NAME is same as the AZURE_SPRING_APPS_SERVICE_INSTANCE_NAME.
Use the following commands to retrieve the Application Insights connection string and set it in Key Vault:
export CONNECTION_STRING=$(az monitor app-insights component show \
    --resource-group ${RESOURCE_GROUP} \
    --app ${APP_INSIGHTS_NAME} \
    --query "connectionString" \
    --output tsv)

az keyvault secret set \
    --vault-name ${KEY_VAULT_NAME} \
    --name "ApplicationInsights--ConnectionString" \
    --value ${CONNECTION_STRING}
Use the following command to update the sampling rate for the Application Insights binding to increase the amount of data available:
az spring build-service builder buildpack-binding set \
    --resource-group ${RESOURCE_GROUP} \
    --service ${AZURE_SPRING_APPS_SERVICE_INSTANCE_NAME} \
    --builder-name default \
    --name default \
    --type ApplicationInsights \
    --properties sampling-rate=100 connection_string=${CONNECTION_STRING}
Use the following commands to restart applications to reload configuration:
az spring app restart \
    --resource-group ${RESOURCE_GROUP} \
    --service ${AZURE_SPRING_APPS_SERVICE_INSTANCE_NAME} \
    --name cart-service

az spring app restart \
    --resource-group ${RESOURCE_GROUP} \
    --service ${AZURE_SPRING_APPS_SERVICE_INSTANCE_NAME} \
    --name order-service

az spring app restart \
    --resource-group ${RESOURCE_GROUP} \
    --service ${AZURE_SPRING_APPS_SERVICE_INSTANCE_NAME} \
    --name catalog-service

az spring app restart \
    --resource-group ${RESOURCE_GROUP} \
    --service ${AZURE_SPRING_APPS_SERVICE_INSTANCE_NAME} \
    --name frontend

az spring app restart \
    --resource-group ${RESOURCE_GROUP} \
    --service ${AZURE_SPRING_APPS_SERVICE_INSTANCE_NAME} \
    --name payment-service
If you've configured single sign-on, use the following commands to restart applications to reload identity-service app configuration:
az spring app restart \
    --resource-group ${RESOURCE_GROUP} \
    --service ${AZURE_SPRING_APPS_SERVICE_INSTANCE_NAME} \
    --name identity-service
For the Java and Node.js applications, restarting will allow the new sampling rate to take effect. For the non-Java applications, restarting will allow them to access the newly added Instrumentation Key from the Key Vault.
View logs
There are two ways to see logs on Azure Spring Apps: log streaming of real-time logs per app instance or Log Analytics for aggregated logs with advanced query capability
Use log streaming
Generate traffic in the application by moving through the application, viewing the catalog, and placing orders. Use the following commands to generate traffic continuously, until canceled:
export GATEWAY_URL=$(az spring gateway show \
    --resource-group ${RESOURCE_GROUP} \
    --service ${AZURE_SPRING_APPS_SERVICE_INSTANCE_NAME} \
    --query "properties.url" \
    --output tsv)

export GATEWAY_URL=https://${GATEWAY_URL}

cd azure-spring-apps-enterprise/load-test/traffic-generator
./gradlew gatlingRun-com.vmware.acme.simulation.GuestSimulation.java
Use the following command to get the latest 100 lines of application console logs from the Catalog Service application:
az spring app logs \
    --resource-group ${RESOURCE_GROUP} \
    --name catalog-service \
    --service ${AZURE_SPRING_APPS_SERVICE_INSTANCE_NAME} \
    --lines 100
By adding the --follow option, you can get real-time log streaming from an app. Use the following command to try log streaming for the Catalog Service application:
az spring app logs \
    --resource-group ${RESOURCE_GROUP} \
    --name catalog-service \
    --service ${AZURE_SPRING_APPS_SERVICE_INSTANCE_NAME} \
    --follow
Tip
You can use az spring app logs --help to explore more parameters and log stream functionalities.
Use Log Analytics
Navigate to the Azure portal and open the Log Analytics instance that you created. You can find the Log Analytics instance in the same resource group where you created the Azure Spring Apps service instance.
On the Log Analytics page, select the Logs pane and run any of the following sample queries for Azure Spring Apps.
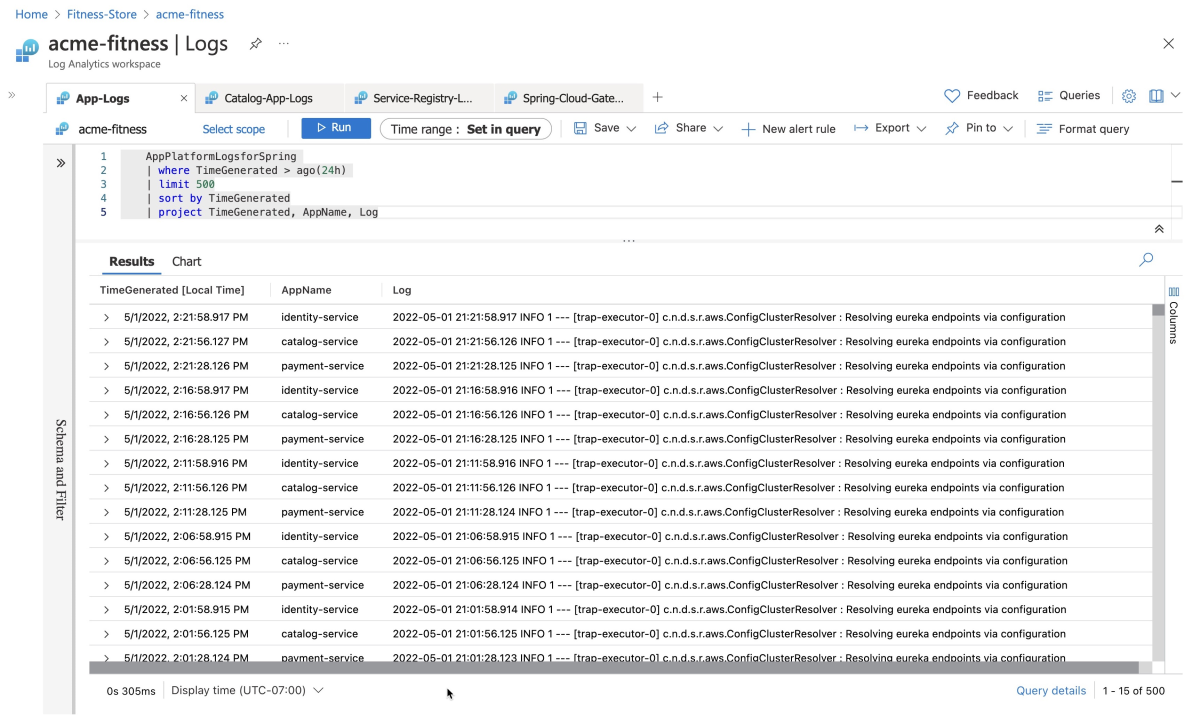
Type and run the following Kusto query to see application logs:
AppPlatformLogsforSpring
| where TimeGenerated > ago(24h)
| limit 500
| sort by TimeGenerated
| project TimeGenerated, AppName, Log
This query produces results similar to the ones shown in the following screenshot:
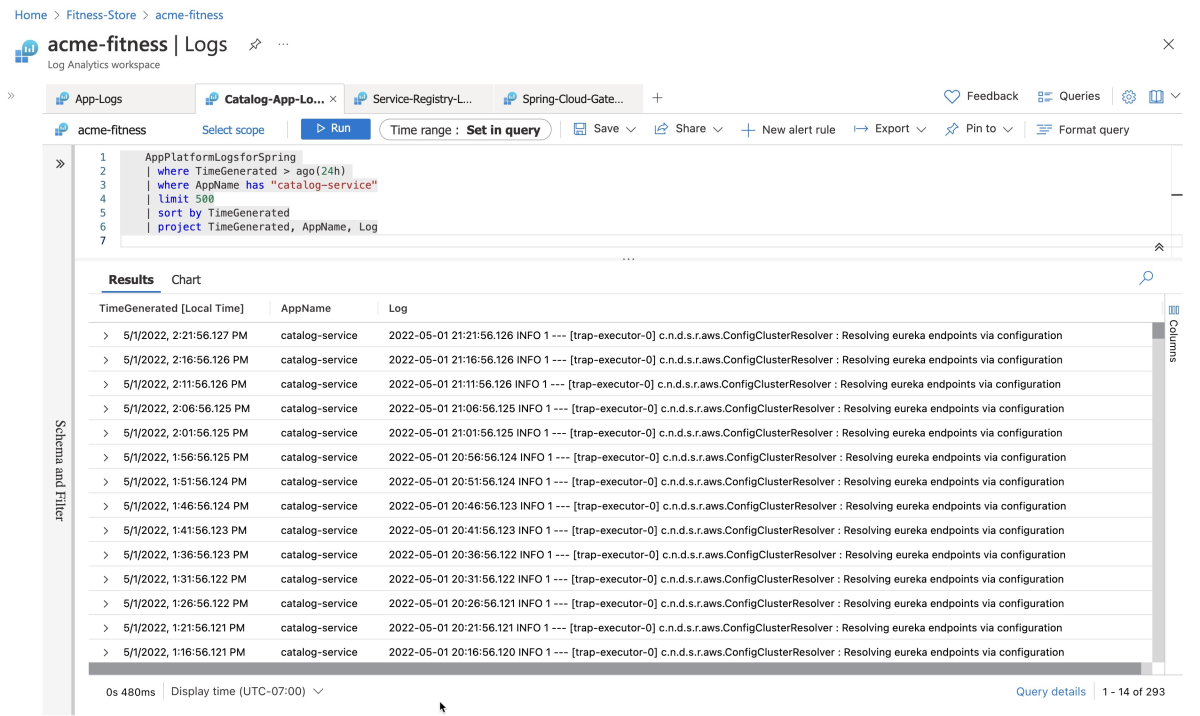
Type and run the following Kusto query to see catalog-service application logs:
AppPlatformLogsforSpring
| where AppName has "catalog-service"
| limit 500
| sort by TimeGenerated
| project TimeGenerated, AppName, Log
This query produces results similar to the ones shown in the following screenshot:
Type and run the following Kusto query to see errors and exceptions thrown by each app:
AppPlatformLogsforSpring
| where Log contains "error" or Log contains "exception"
| extend FullAppName = strcat(ServiceName, "/", AppName)
| summarize count_per_app = count() by FullAppName, ServiceName, AppName, _ResourceId
| sort by count_per_app desc
| render piechart
This query produces results similar to the ones shown in the following screenshot:
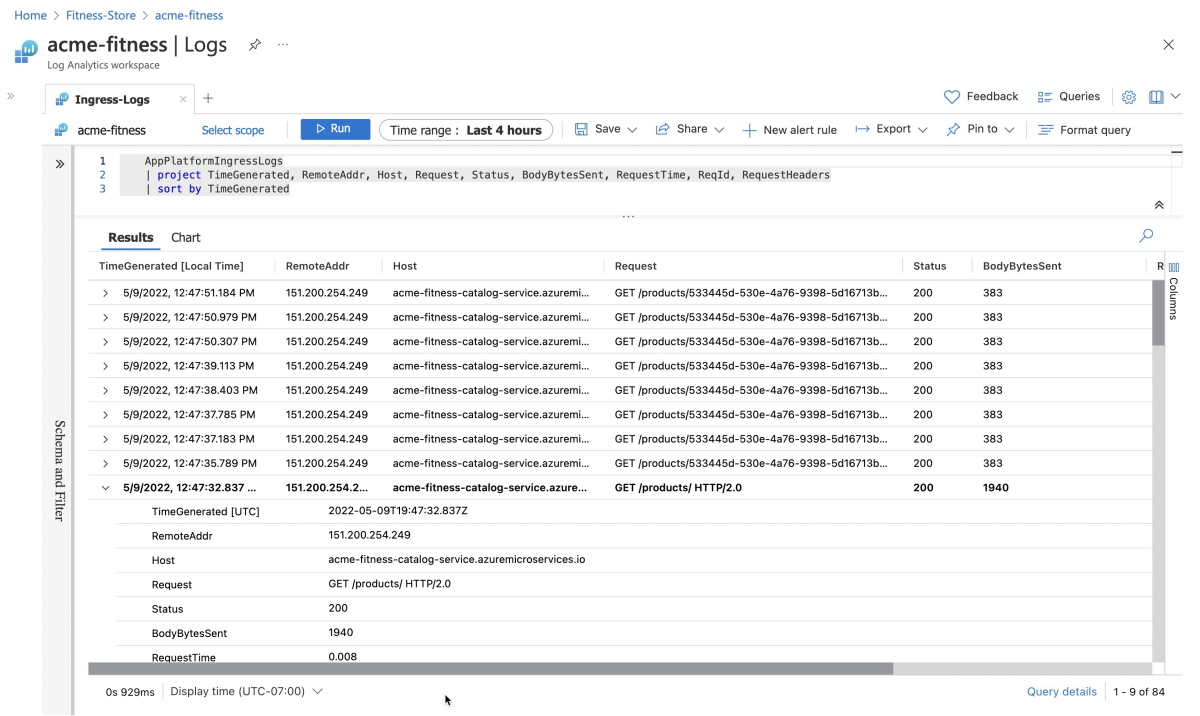
Type and run the following Kusto query to see all in the inbound calls into Azure Spring Apps:
AppPlatformIngressLogs
| project TimeGenerated, RemoteAddr, Host, Request, Status, BodyBytesSent, RequestTime, ReqId, RequestHeaders
| sort by TimeGenerated
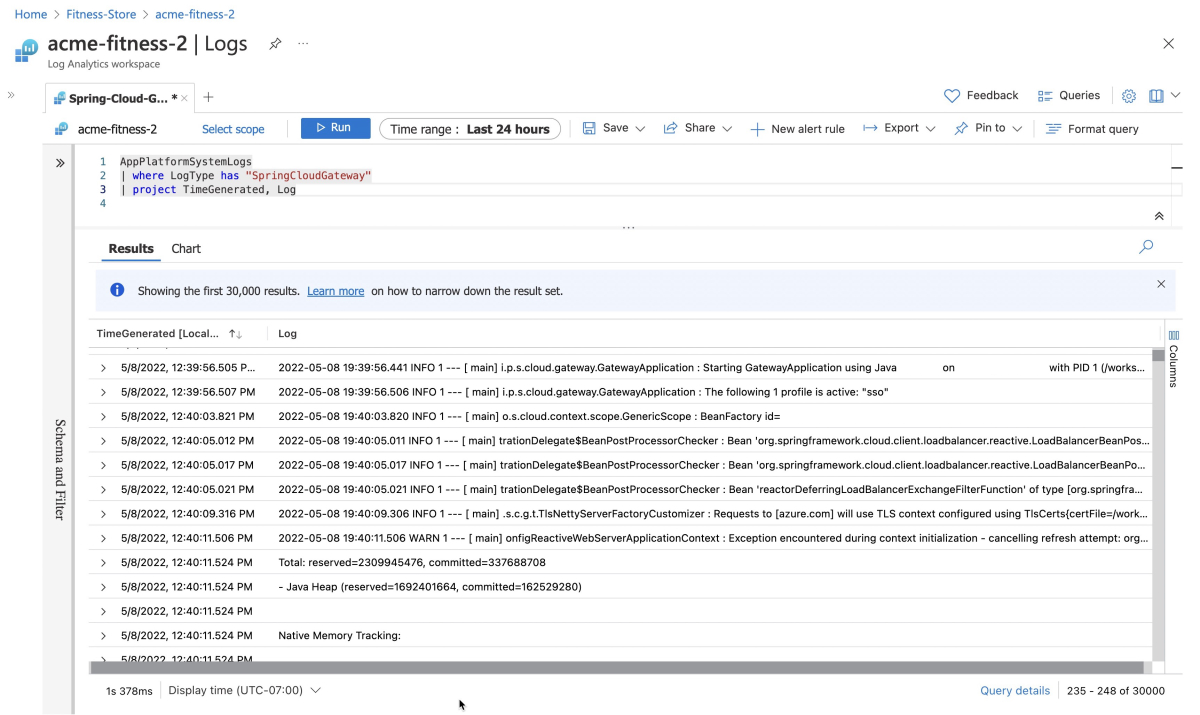
Type and run the following Kusto query to see all the logs from the managed Spring Cloud Config Gateway managed by Azure Spring Apps:
AppPlatformSystemLogs
| where LogType contains "SpringCloudGateway"
| project TimeGenerated,Log
This query produces results similar to the ones shown in the following screenshot:
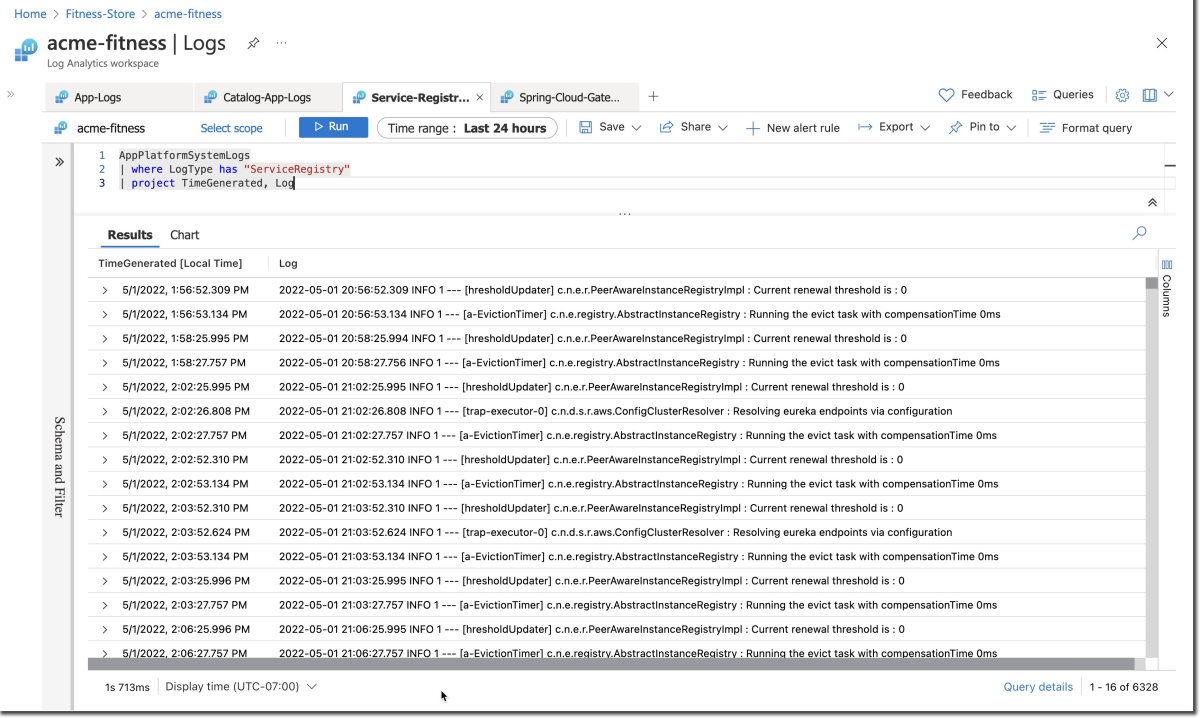
Type and run the following Kusto query to see all the logs from the managed Spring Cloud Service Registry managed by Azure Spring Apps:
AppPlatformSystemLogs
| where LogType contains "ServiceRegistry"
| project TimeGenerated, Log
This query produces results similar to the ones shown in the following screenshot:
Use tracing
In the Azure portal, open the Application Insights instance created by Azure Spring Apps and start monitoring Spring Boot applications. You can find the Application Insights instance in the same resource group where you created an Azure Spring Apps service instance.
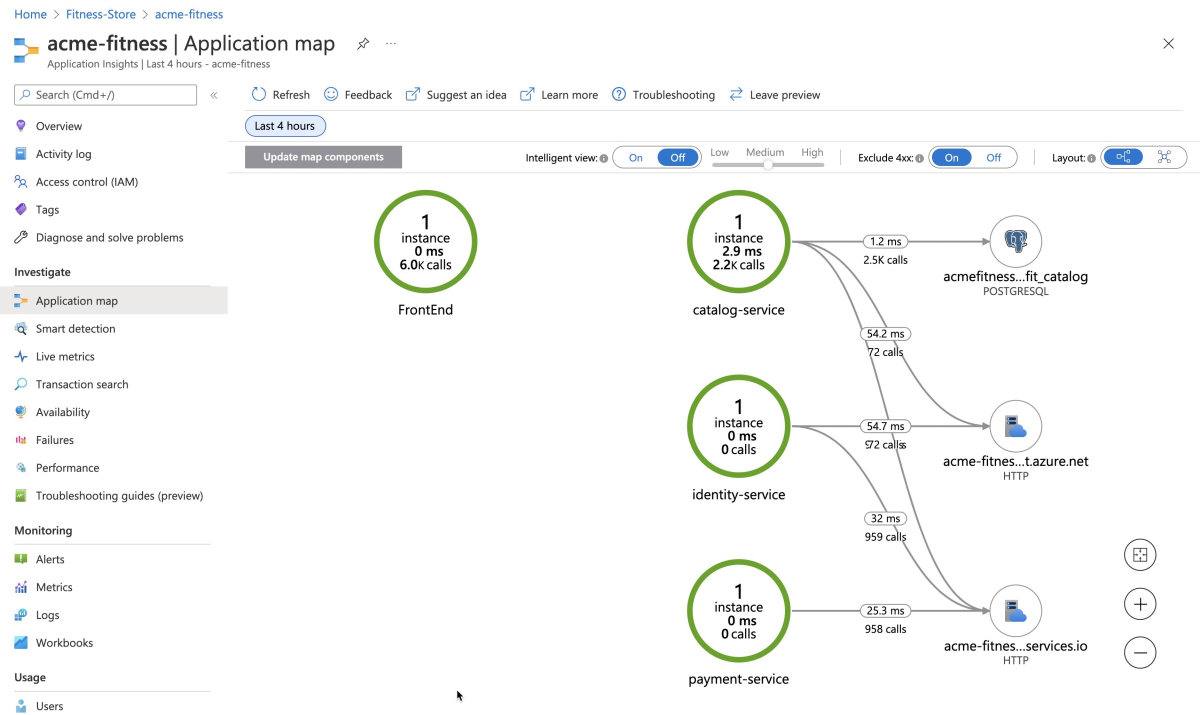
Navigate to the Application map pane, which will be similar to the following screenshot:
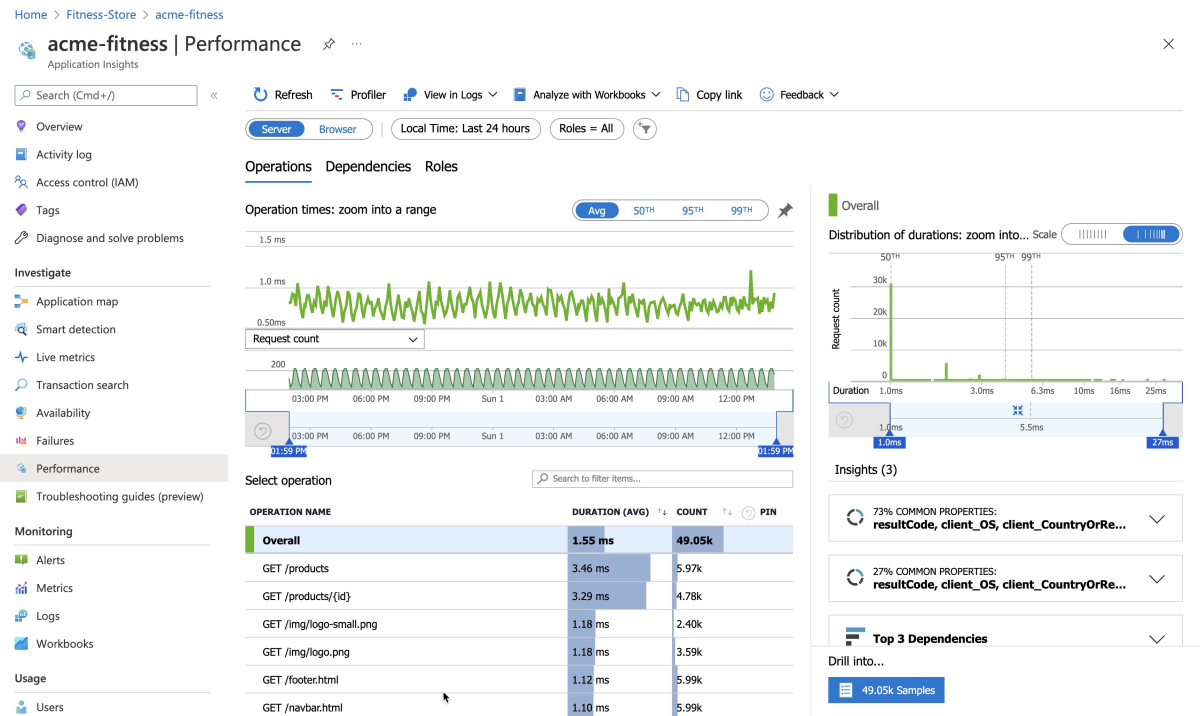
Navigate to the Performance pane, which will be similar to the following screenshot:
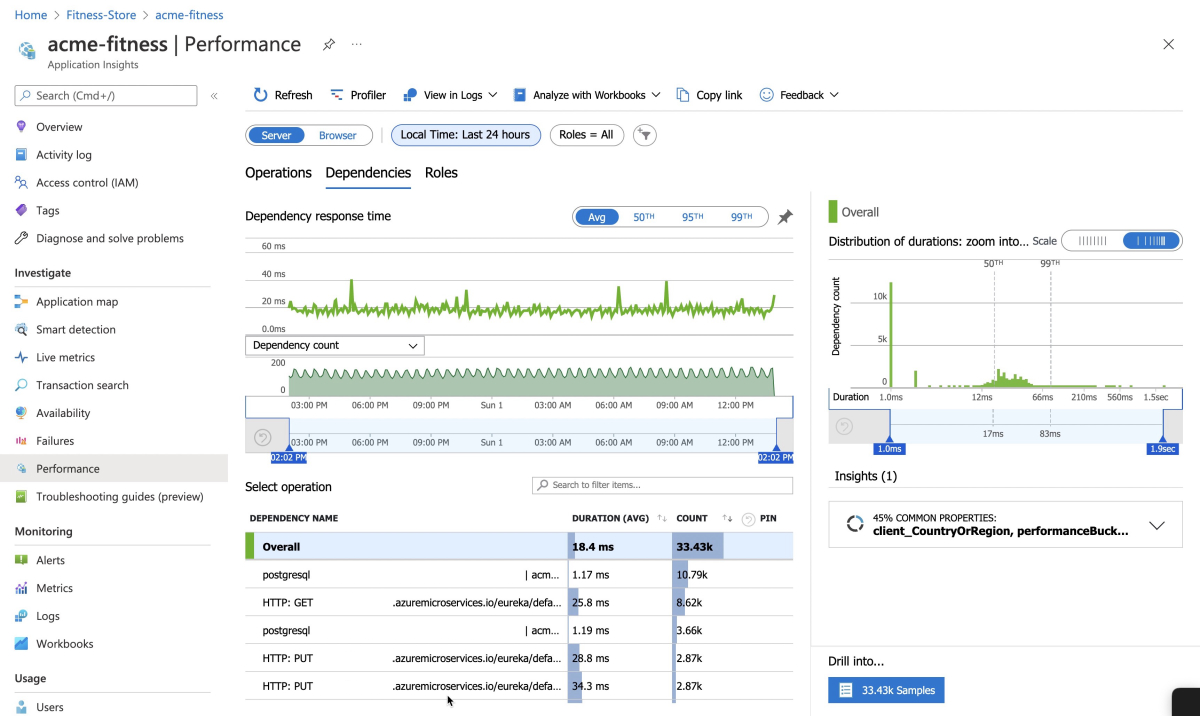
Navigate to the Performance/Dependencies pane. Here you can see the performance number for dependencies, particularly SQL calls, similar to what's shown in the following screenshot:
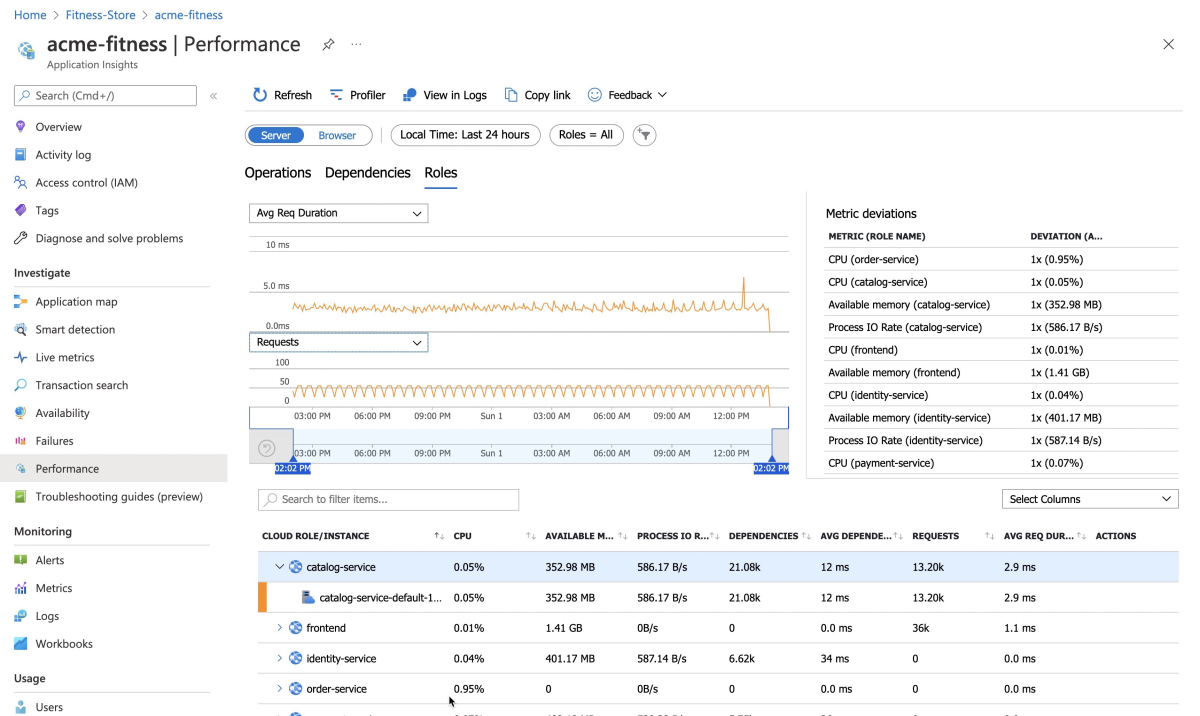
Navigate to the Performance/Roles pane. Here you can see the performance metrics for individual instances or roles, similar to what's shown in the following screenshot:
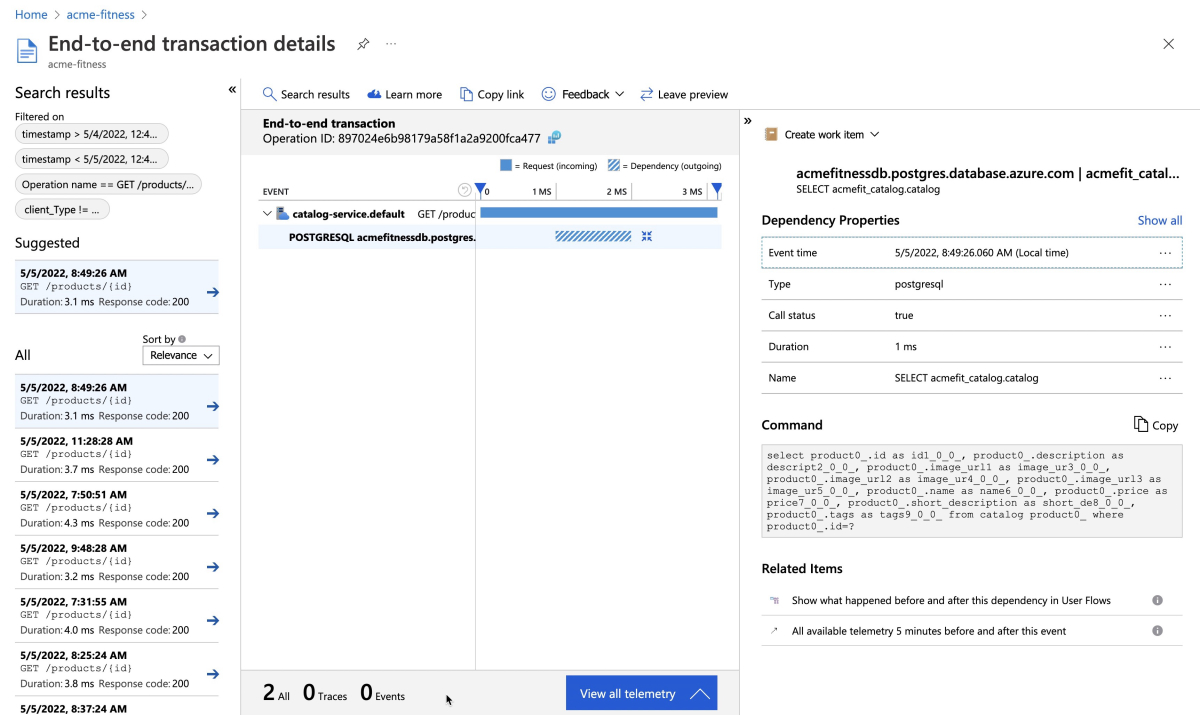
Select a SQL call to see the end-to-end transaction in context, similar to what's shown in the following screenshot:
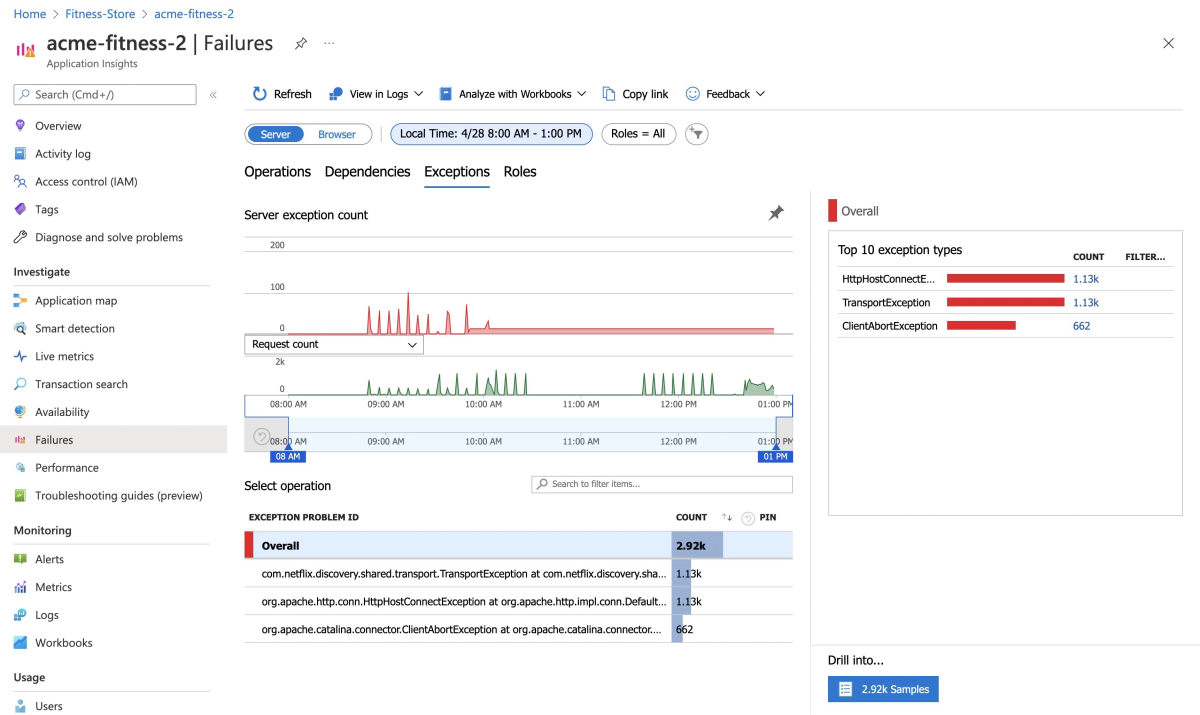
Navigate to the Failures/Exceptions pane. Here you can see a collection of exceptions, similar to what's shown in the following screenshot:
View metrics
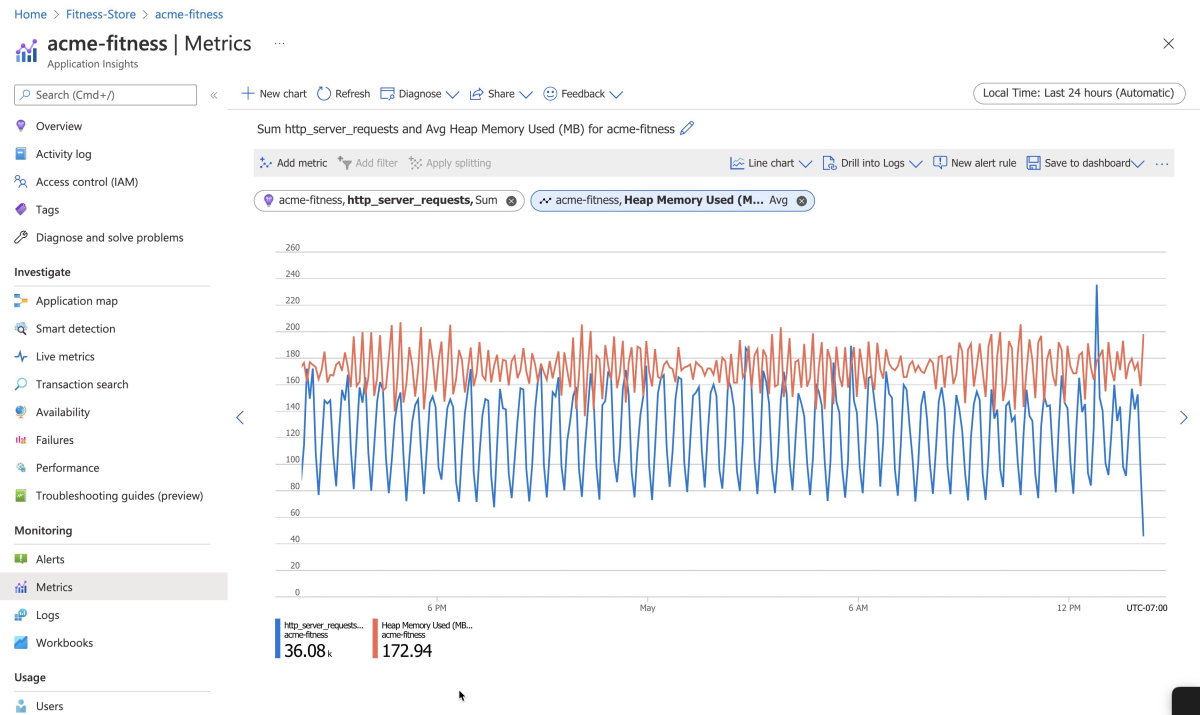
Navigate to the Metrics pane. Here you can see metrics contributed by Spring Boot apps, Spring Cloud modules, and dependencies. The chart in the following screenshot shows http_server_requests and Heap Memory Used:
Spring Boot registers a large number of core metrics: JVM, CPU, Tomcat, Logback, and so on.
The Spring Boot auto-configuration enables the instrumentation of requests handled by Spring MVC.
The REST controllers ProductController and PaymentController have been instrumented by the @Timed Micrometer annotation at the class level.
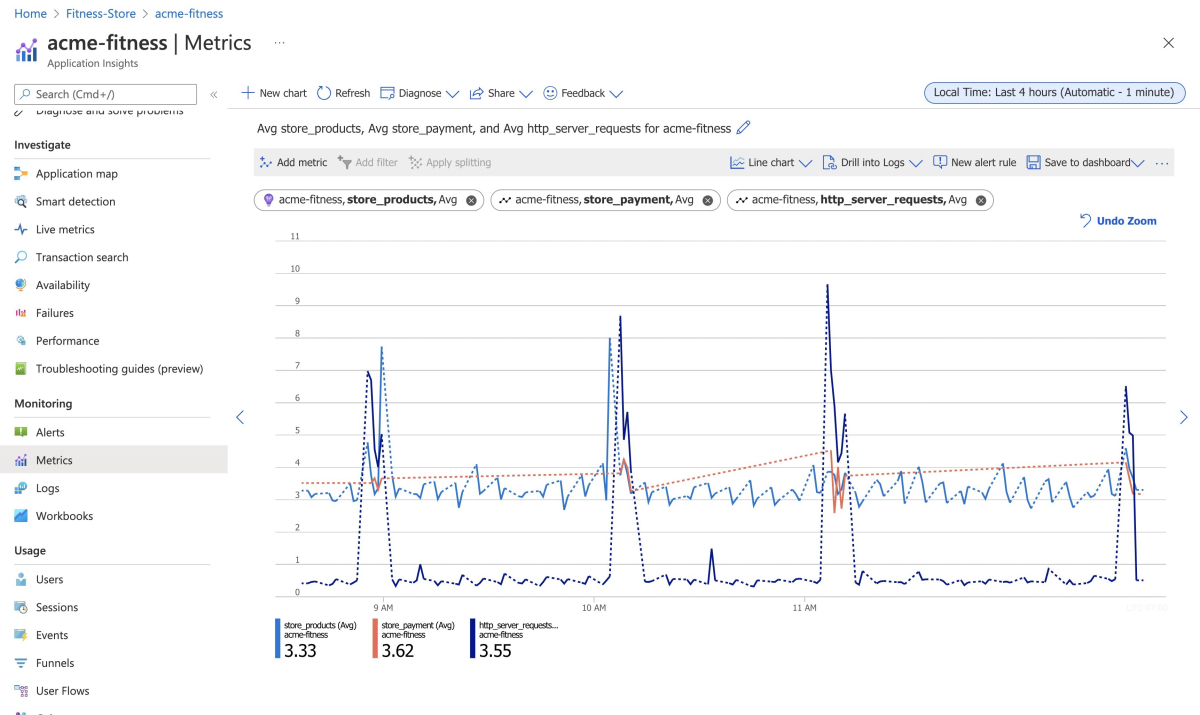
The acme-catalog application has the following custom metric enabled: @Timed: store.products
The acem-payment application has the following custom metric enabled: @Timed: store.payment
You can see these custom metrics in the Metrics pane, as shown in the following screenshot.
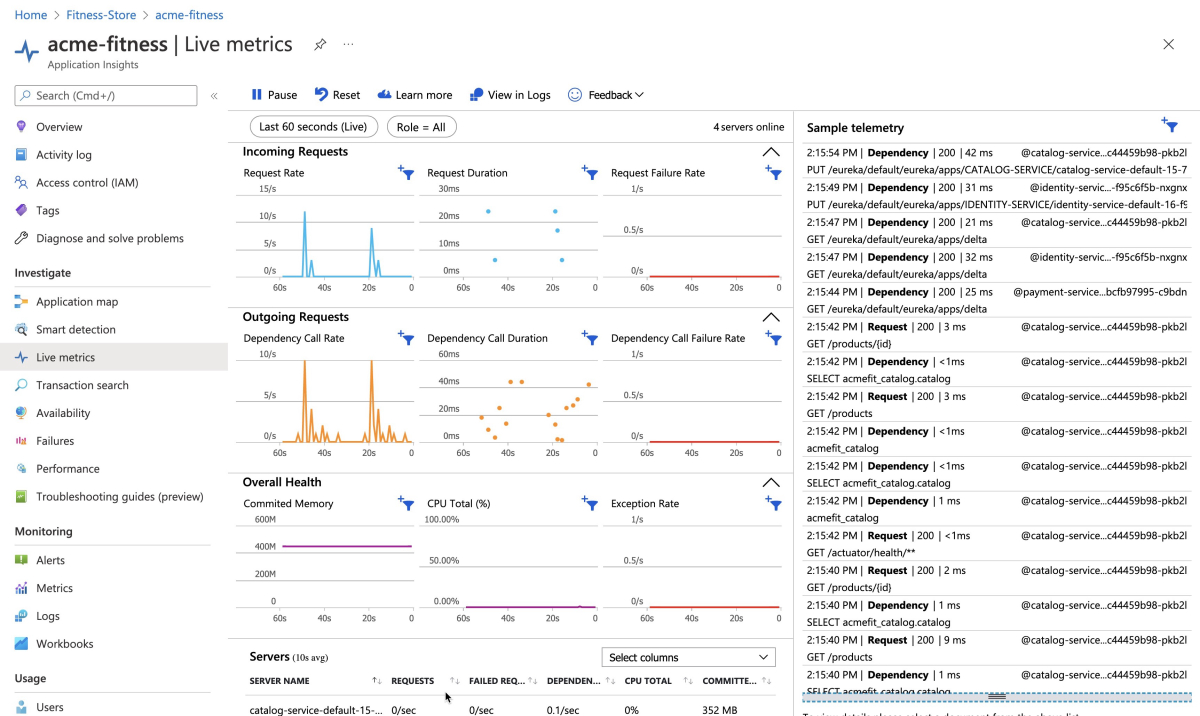
Navigate to the Live Metrics pane. Here you can see live metrics on screen with low latencies < 1 second, as shown in the following screenshot:
Working with other monitoring tools
The Azure Spring Apps Enterprise plan also supports exporting metrics to other tools, including the following tools:
- AppDynamics
- ApacheSkyWalking
- Dynatrace
- ElasticAPM
- NewRelic
You can add more bindings to a builder in Tanzu Build Service by using the following command:
az spring build-service builder buildpack-binding create \
    --resource-group <resource-group-name> \
    --service <Azure-Spring-Apps-service-instance-name> \
    --builder-name <builder-name> \
    --name <binding-name> \
    --type <ApplicationInsights|AppDynamics|ApacheSkyWalking|Dynatrace|ElasticAPM|NewRelic> \
    --properties <connection-properties>
    --secrets <secret-properties>
Clean up resources
If you plan to continue working with subsequent quickstarts and tutorials, you might want to leave these resources in place. When no longer needed, delete the resource group, which deletes the resources in the resource group. To delete the resource group by using Azure CLI, use the following commands:
echo "Enter the Resource Group name:" &&
read resourceGroupName &&
az group delete --name $resourceGroupName &&
echo "Press [ENTER] to continue ..."
Next steps
Continue on to any of the following optional quickstarts:
