Debug your apps remotely in Azure Spring Apps
Note
The Basic, Standard, and Enterprise plans will be deprecated starting from mid-March, 2025, with a 3 year retirement period. We recommend transitioning to Azure Container Apps. For more information, see the Azure Spring Apps retirement announcement.
The Standard consumption and dedicated plan will be deprecated starting September 30, 2024, with a complete shutdown after six months. We recommend transitioning to Azure Container Apps. For more information, see Migrate Azure Spring Apps Standard consumption and dedicated plan to Azure Container Apps.
This article applies to: ✅ Basic/Standard ✅ Enterprise
This feature describes how to enable remote debugging of your applications in Azure Spring Apps.
Prerequisites
Azure CLI with the Azure Spring Apps extension. Use the following command to remove previous versions and install the latest extension. If you previously installed the spring-cloud extension, uninstall it to avoid configuration and version mismatches.
az extension remove --name spring
az extension add --name spring
az extension remove --name spring-cloud
A deployed application in Azure Spring Apps.
Enable or disable remote debugging
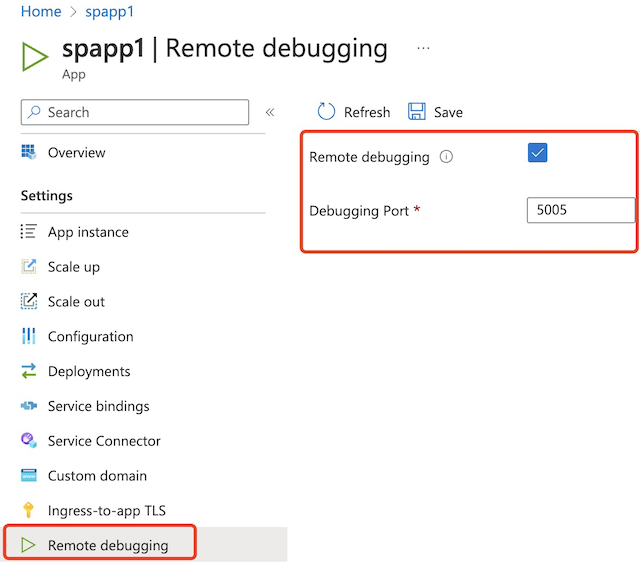
For security reasons, Azure Spring Apps disables remote debugging by default. Based on your company policy, you can enable remote debugging for your app yourself or see an admin to enable it for you. You can enable or disable remote debugging using Azure CLI, Azure portal, or the VS Code extension.
Use the following steps to enable remote debugging for your application using the Azure portal:
Assign an Azure role
To remotely debug an app instance, you must be granted the role Azure Spring Apps Remote Debugging Role, which includes the Microsoft.AppPlatform/Spring/apps/deployments/remotedebugging/action data action permission.
You can assign an Azure role using the Azure portal or Azure CLI.
Use the following steps to assign an Azure role using the Azure portal.
Open the Azure portal.
Open your Azure Spring Apps service instance.
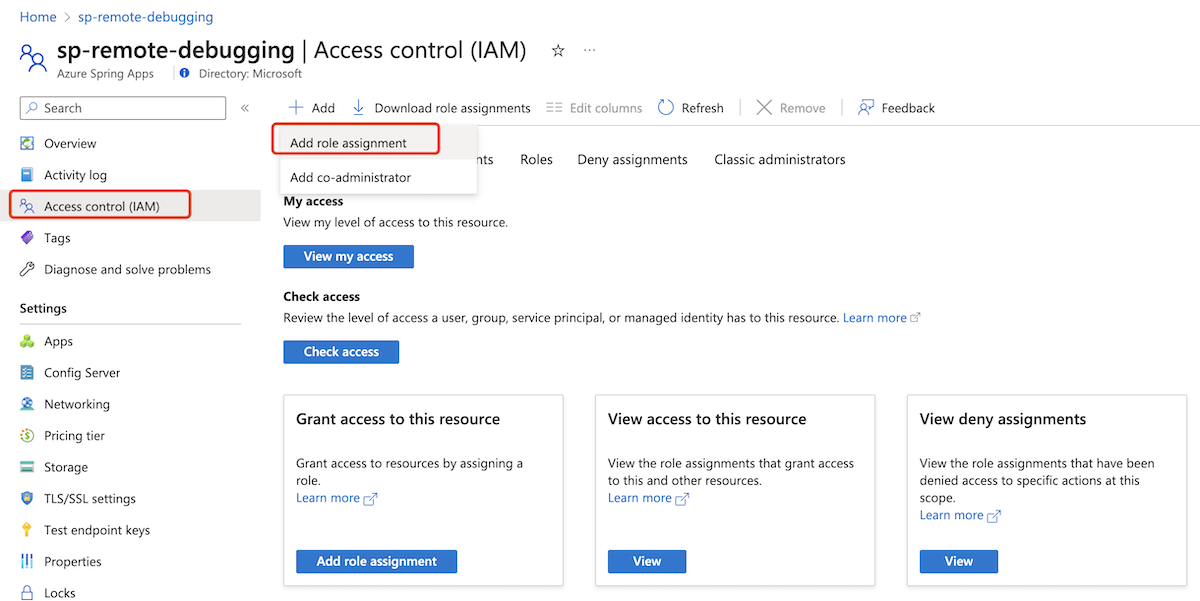
In the navigation pane, select Access Control (IAM).
On the Access Control (IAM) page, select Add, and then select Add role assignment.
On the Add role assignment page, in the Name list, search for and select Azure Spring Apps Remote Debugging Role, and then select Next.
Select Members, and then search for and select your username.
Select Review + assign.
Debug an app instance remotely
You can debug an app instance remotely using the Azure Toolkit for IntelliJ or the Azure Spring Apps for VS Code extension.
This section describes how to debug an app instance remotely using the Azure Toolkit for IntelliJ.
Prerequisites
- Azure Toolkit for IntelliJ.
- IntelliJ IDEA, Ultimate or Community edition.
Enable or disable remote debugging
Use the following steps to enable or disable remote debugging:
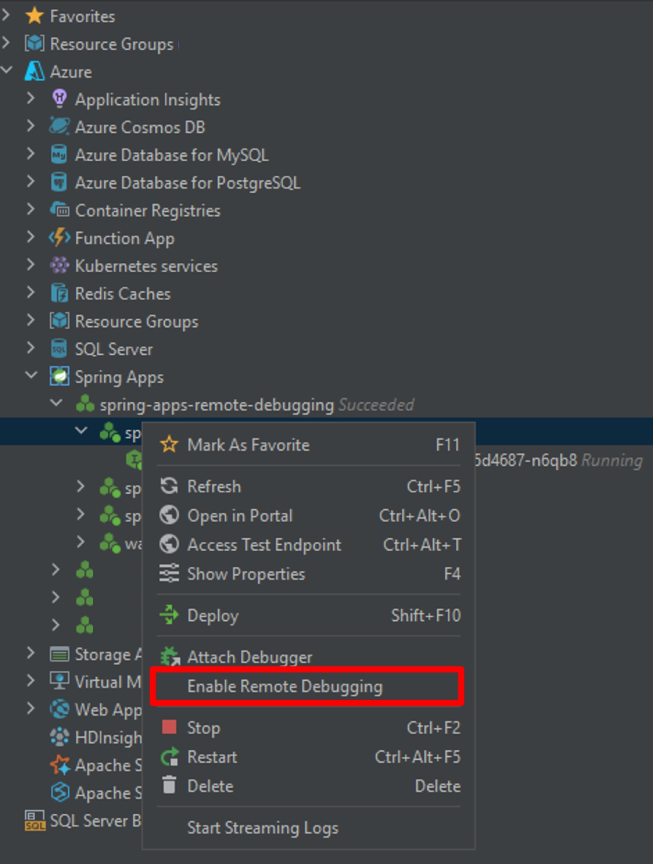
Sign in to your Azure account in Azure Explorer.
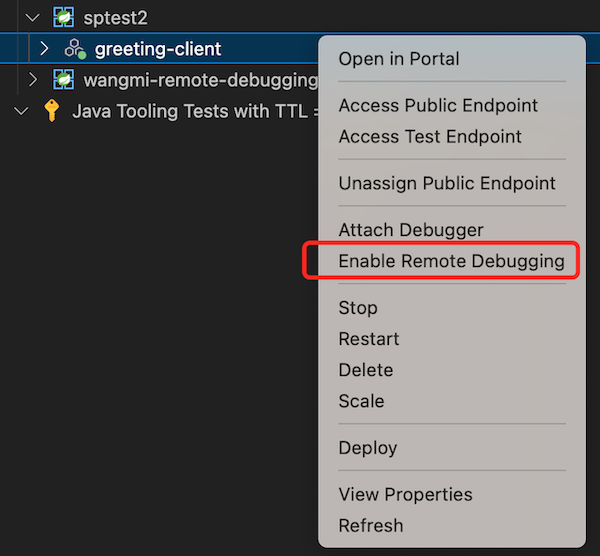
Select an app instance, and then select Enable Remote Debugging.
Attach debugger
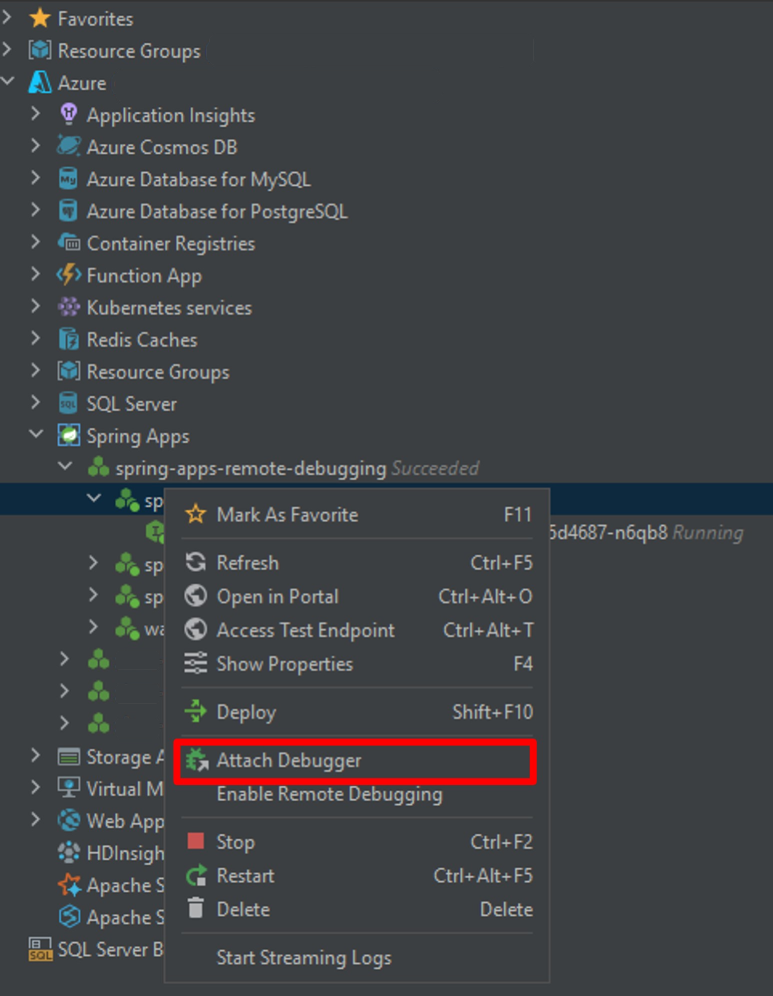
Use the following steps to attach debugger.
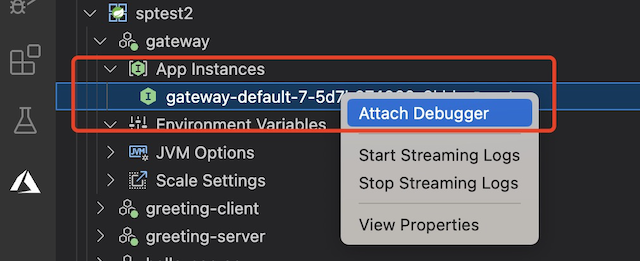
Select an app instance, and then select Attach Debugger. IntelliJ connects to the app instance and starts remote debugging.
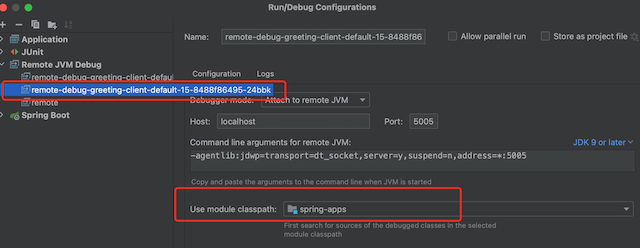
Azure Toolkit for IntelliJ creates the remote debugging configuration. You can find it under Remote Jvm Debug" Configure the module class path to the source code that you use for remote debugging.
Troubleshooting
This section provides troubleshooting information.
Take the following actions if you fail to attach debugger and receive an error similar to
java.net.SocketException, connection resetorFailed to attach to remote debugger, ClosedConnectionException:Take the following actions if you successfully attach debugger but can't remotely debug the app instance:
- Make sure that your IDE contains the source code you want to debug.
- Make sure that the debug configuration has the correct module class path.
Limitations
Remote debugging is only supported for Java applications.
| Plan | Deployment type | Supported |
|---|---|---|
| Standard and basic plan | Jar | Yes |
| Standard and basic plan | Source code(Java) | Yes |
| Standard and basic plan | Custom Image | No |
| Enterprise plan | Java Application | Yes |
| Enterprise plan | Source code(Java) | Yes |
| Enterprise plan | Custom Image | No |
Tips
- Java remote debugging is dangerous because it allows remote code execution. Azure Spring Apps helps you secure the communication between your client IDE and the remote application. However, you should disable remote debugging and remove the RBAC role after you're finished.
- You should scale in the app instance to one to ensure that traffic can go to the instance.
