How to monitor Spring Boot apps with Dynatrace Java OneAgent
Note
The Basic, Standard, and Enterprise plans will be deprecated starting from mid-March, 2025, with a 3 year retirement period. We recommend transitioning to Azure Container Apps. For more information, see the Azure Spring Apps retirement announcement.
The Standard consumption and dedicated plan will be deprecated starting September 30, 2024, with a complete shutdown after six months. We recommend transitioning to Azure Container Apps. For more information, see Migrate Azure Spring Apps Standard consumption and dedicated plan to Azure Container Apps.
This article applies to: ✅ Standard consumption and dedicated (Preview) ✅ Basic/Standard ❎️ Enterprise
This article shows you how to use Dynatrace OneAgent to monitor Spring Boot applications in Azure Spring Apps.
With the Dynatrace OneAgent, you can:
- Monitor apps with the Dynatrace OneAgent.
- Configure the Dynatrace OneAgent by using environment variables.
- Check all monitoring data from Dynatrace dashboard.
The following video introduces Dynatrace OneAgent.
Prerequisites
Activate Dynatrace OneAgent
The following sections describe how to activate Dynatrace OneAgent.
Prepare your Azure Spring Apps environment
- Create an instance of Azure Spring Apps.
- Create an application that you want to report to Dynatrace by running the following command. Replace the placeholders <...> with your own values.
az spring app create \
    --resource-group <your-resource-group-name> \
    --service <your-Azure-Spring-Apps-name> \
    --name <your-application-name> \
    --is-public true
Determine the values for the required environment variables
To activate Dynatrace OneAgent on your Azure Spring Apps instance, you need to configure four environment variables: DT_TENANT, DT_TENANTTOKEN, DT_CONNECTION_POINT, and DT_CLUSTER_ID. For more information, see Integrate OneAgent with Azure Spring Apps.
For applications with multiple instances, Dynatrace has several ways to group them. DT_CLUSTER_ID is one of the ways. For more information, see Process group detection.
Add the environment variables to your application
You can add the environment variable key/value pairs to your application using either the Azure portal or the Azure CLI.
Option 1: Azure CLI
To add the key/value pairs using the Azure CLI, run the following command, replacing the placeholders <...> with the values determined in the previous steps.
az spring app deploy \
    --resource-group <your-resource-group-name> \
    --service <your-Azure-Spring-Apps-name> \
    --name <your-application-name> \
    --artifact-path app.jar \
    --env \
        DT_TENANT=<your-environment-ID> \
        DT_TENANTTOKEN=<your-tenant-token> \
        DT_CONNECTION_POINT=<your-communication-endpoint>
Option 2: Azure portal
To add the key/value pairs using the Azure portal, use the following steps:
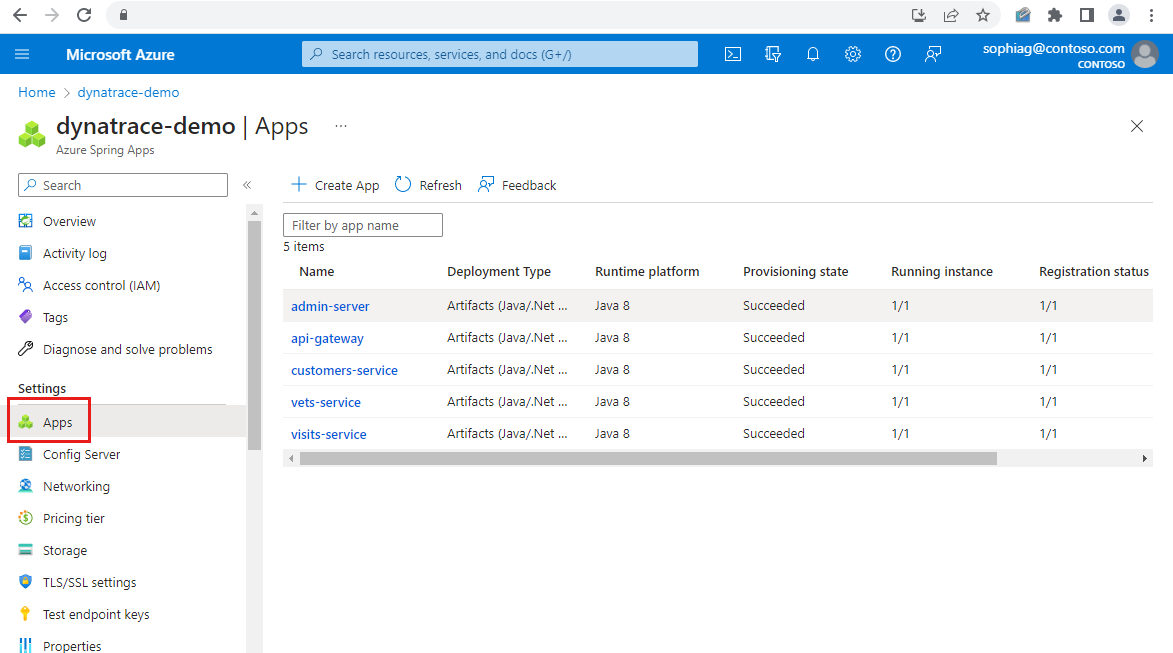
In your Azure Spring Apps instance, select Apps in the navigation pane.
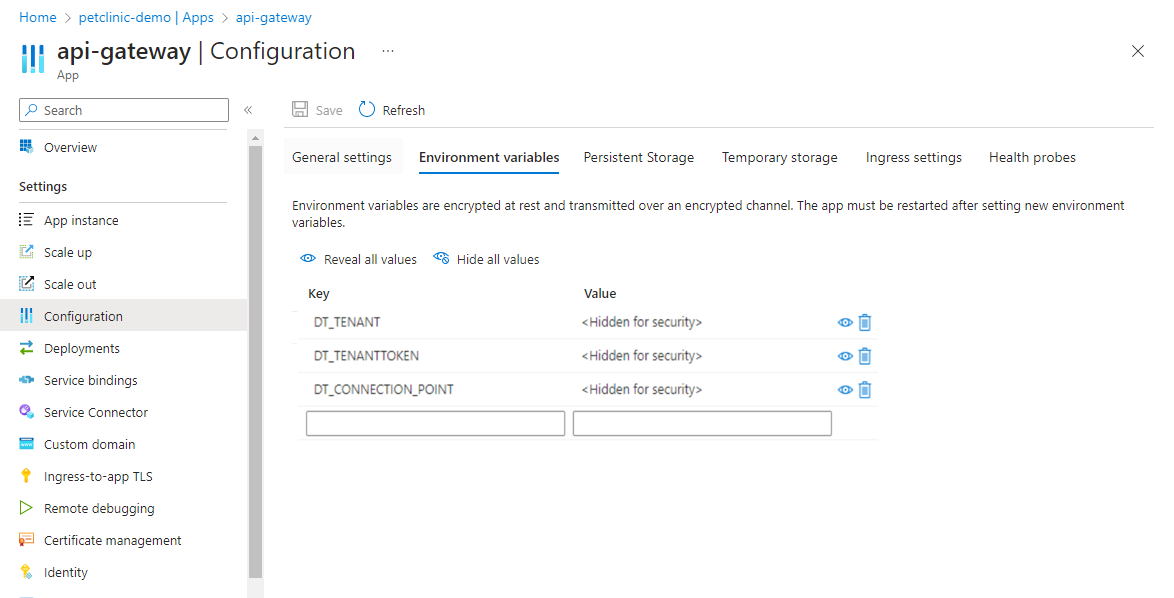
Select the application from the list, and then select Configuration in the navigation pane.
Use the Environment variables tab to add or update the variables used by your application.
Automate provisioning
Using Terraform, Bicep, or Azure Resource Manager template (ARM template), you can also run a provisioning automation pipeline. This pipeline can provide a complete hands-off experience to instrument and monitor any new applications that you create and deploy.
Automate provisioning using Terraform
To configure the environment variables in a Terraform template, add the following code to the template, replacing the <...> placeholders with your own values. For more information, see Manages an Active Azure Spring Apps Deployment.
environment_variables = {
  "DT_TENANT": "<your-environment-ID>",
  "DT_TENANTTOKEN": "<your-tenant-token>",
  "DT_CONNECTION_POINT": "<your-communication-endpoint>",
  "DT_CLUSTER_ID": "<your-cluster-ID>"
}
Automate provisioning using a Bicep file
To configure the environment variables in a Bicep file, add the following code to the file, replacing the <...> placeholders with your own values. For more information, see Microsoft.AppPlatform Spring/apps/deployments.
environmentVariables: {
  DT_TENANT: '<your-environment-ID>'
  DT_TENANTTOKEN: '<your-tenant-token>'
  DT_CONNECTION_POINT: '<your-communication-endpoint>'
  DT_CLUSTER_ID: '<your-cluster-ID>'
}
Automate provisioning using an ARM template
To configure the environment variables in an ARM template, add the following code to the template, replacing the <...> placeholders with your own values. For more information, see Microsoft.AppPlatform Spring/apps/deployments.
"environmentVariables": {
  "DT_TENANT": "<your-environment-ID>",
  "DT_TENANTTOKEN": "<your-tenant-token>",
  "DT_CONNECTION_POINT": "<your-communication-endpoint>",
  "DT_CLUSTER_ID": "<your-cluster-ID>"
}
View reports in Dynatrace
This section describes how to find various reports in Dynatrace.
Note
The Dynatrace menu and user interface will evolve gradually. For this reason, the dashboard may be moved to other sections in the Dynatrace website, and the following screenshots may not reflect the current version of the user interface.
After you add the environment variables to your application, Dynatrace starts collecting data. To view reports, use the Dynatrace menu, go to Services, and then select your application.
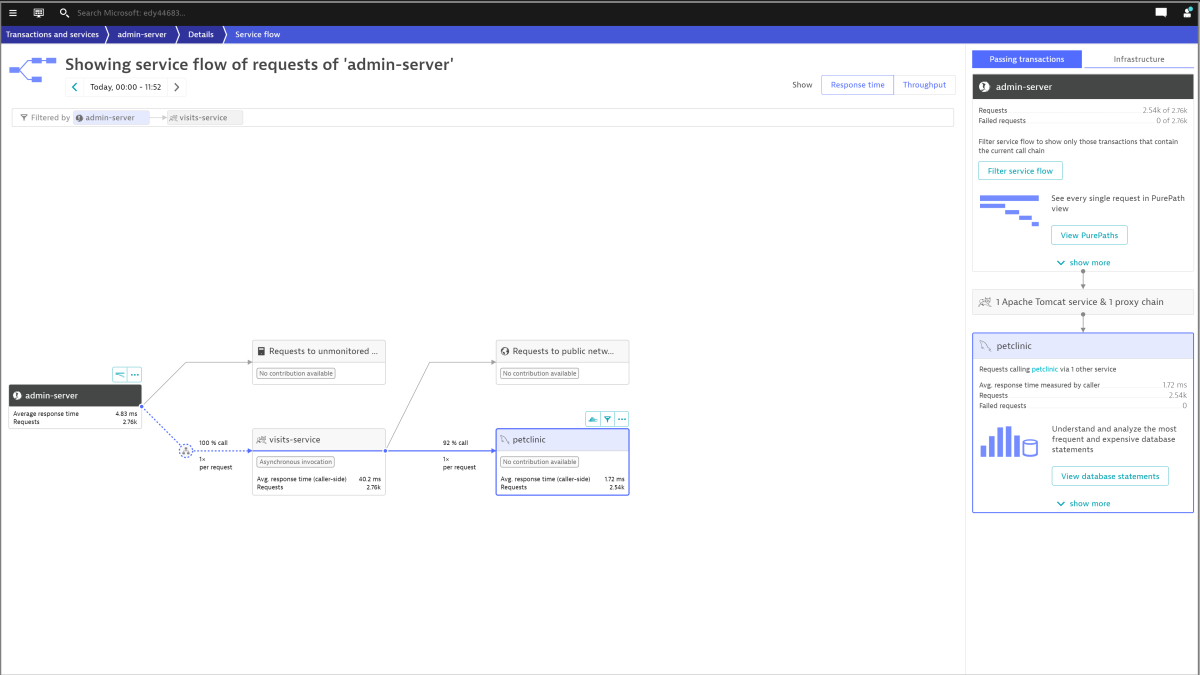
You can find the Service flow from <your-app-name>/Details/Service flow:
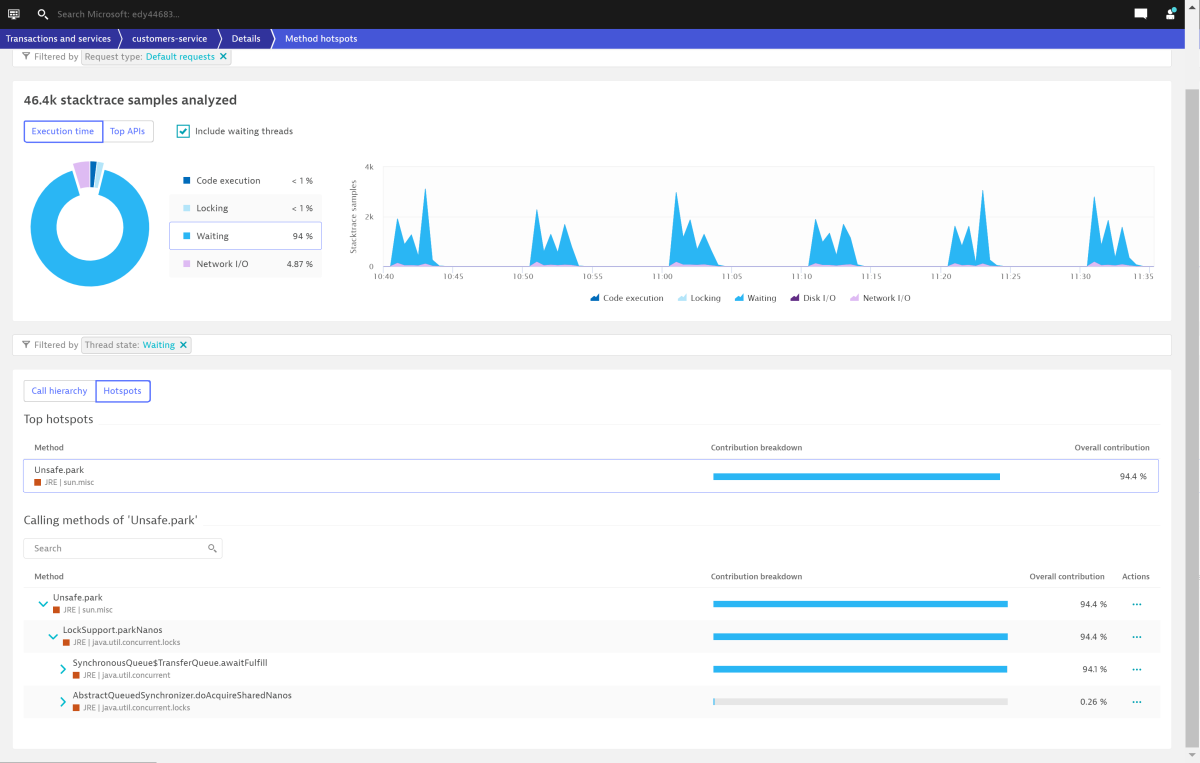
You can find the Method hotspots from <your-app-name>/Details/Method hotspots:
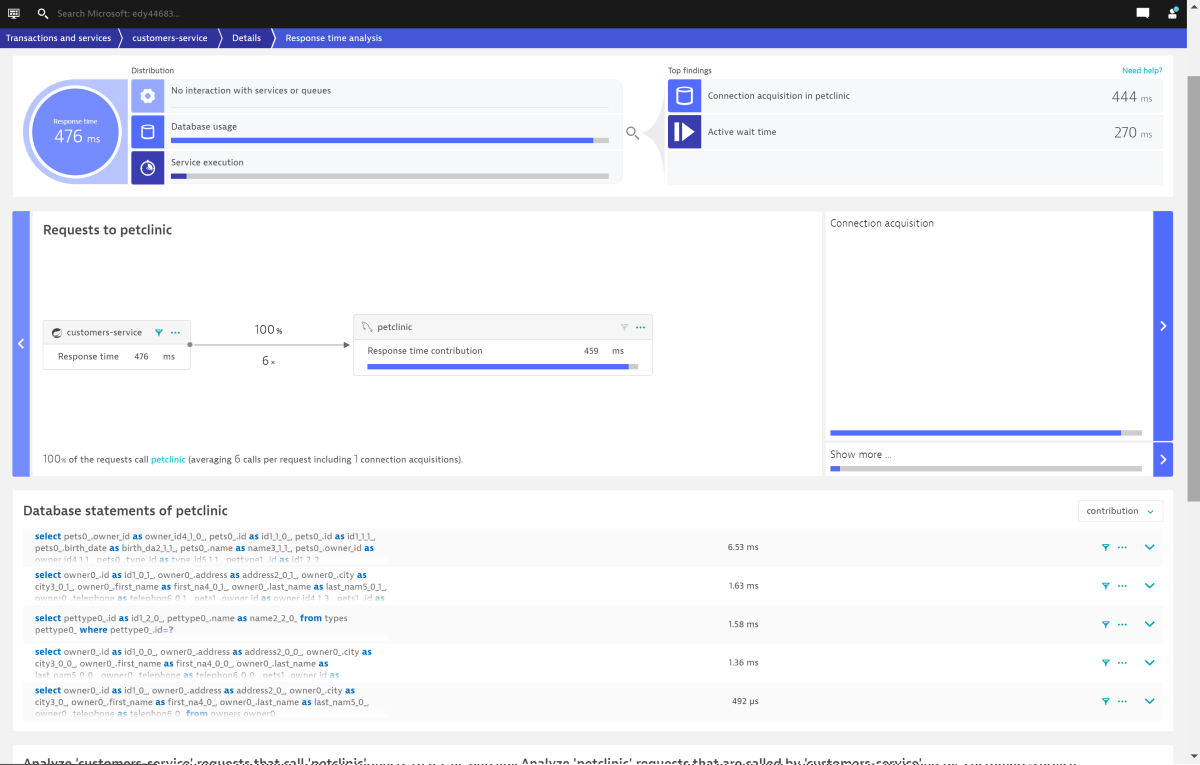
You can find the Database statements from <your-app-name>/Details/Response time analysis:
Next, go to the Multidimensional analysis section.
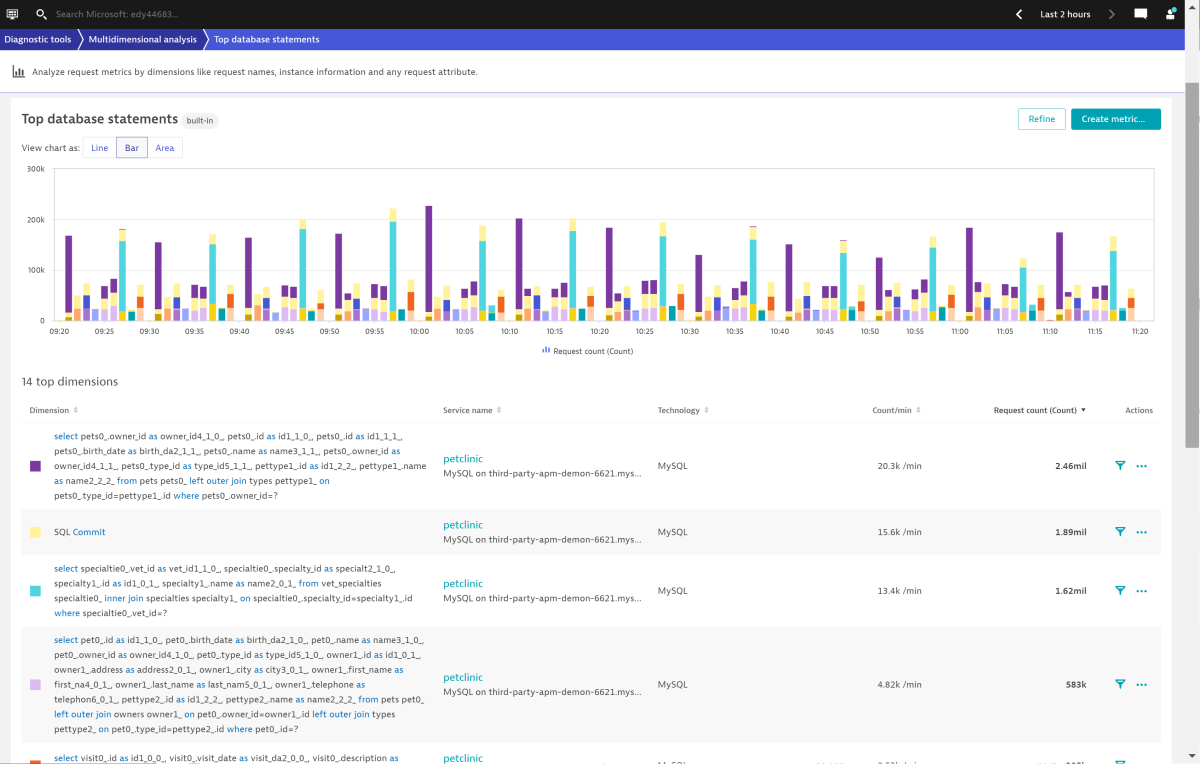
You can find the Top database statements from Multidimensional analysis/Top database statements:
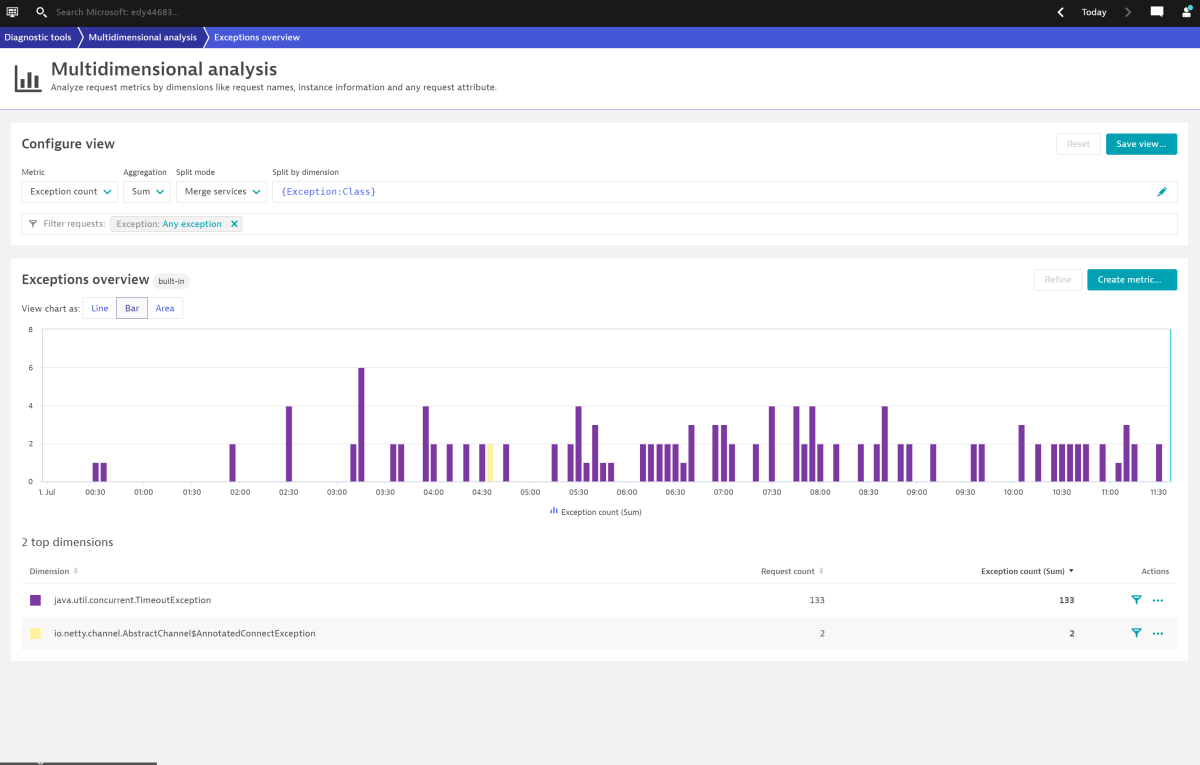
You can find the Exceptions overview from Multidimensional analysis/Exceptions overview:
Next, go to the Profiling and optimization section.
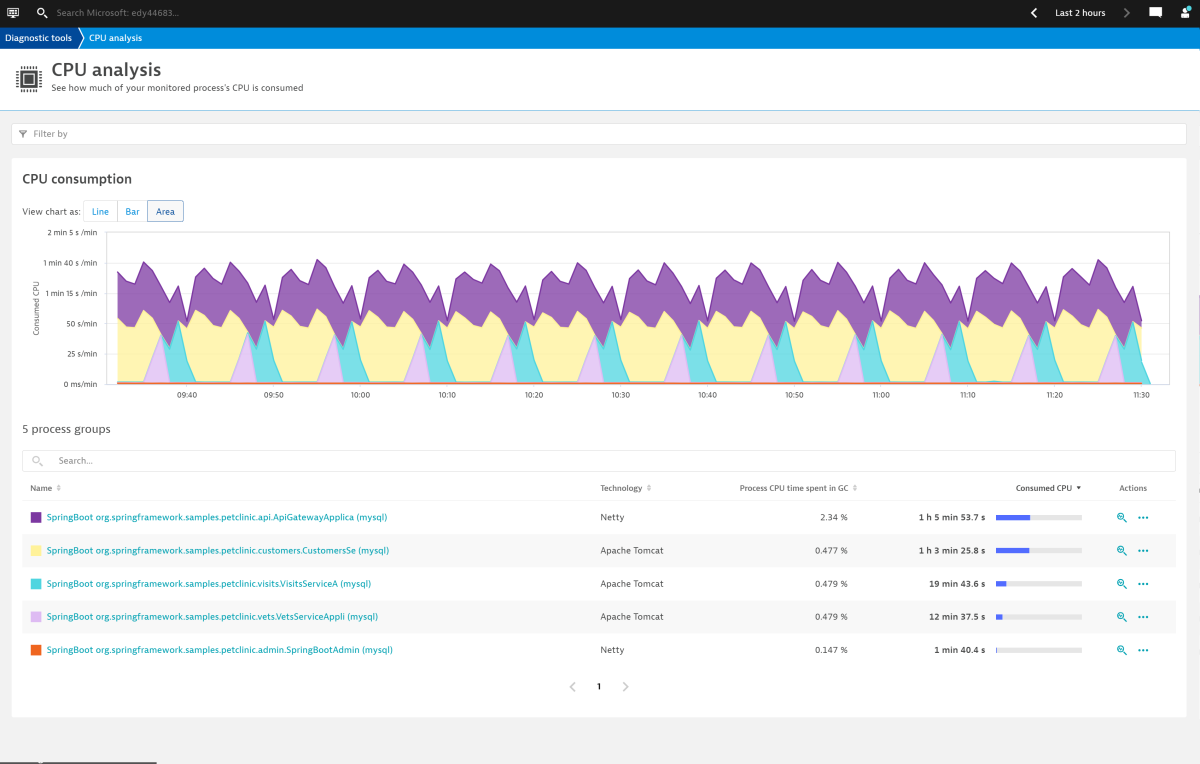
You can find the CPU analysis from Profiling and optimization/CPU analysis:
Next, go to the Databases section.
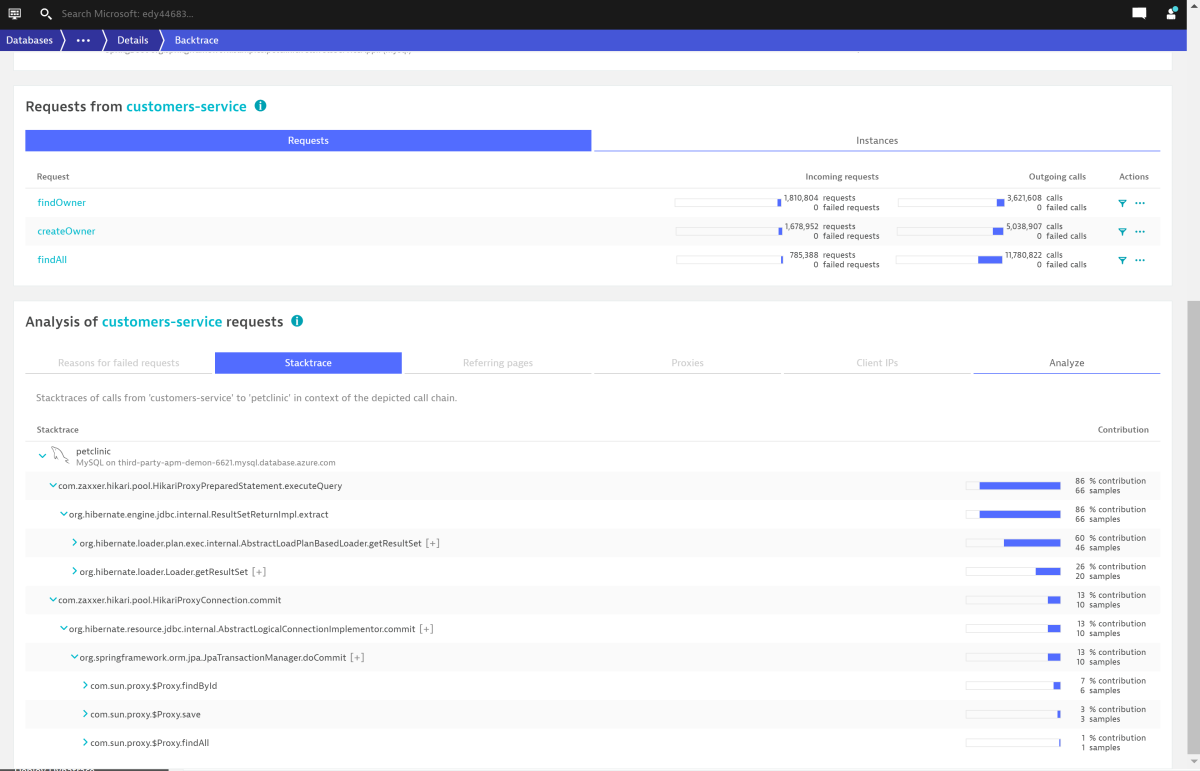
You can find Backtrace from Databases/Details/Backtrace:
View Dynatrace OneAgent logs
By default, Azure Spring Apps prints the info level logs of the Dynatrace OneAgent to STDOUT. The logs are mixed with the application logs. You can find the explicit agent version from the application logs.
You can also get the logs of the Dynatrace agent from the following locations:
- Azure Spring Apps logs
- Azure Spring Apps Application Insights
- Azure Spring Apps LogStream
You can apply some environment variables provided by Dynatrace to configure logging for the Dynatrace OneAgent. For example, DT_LOGLEVELCON controls the level of logs. The default value for DT_LOGLEVELCON is info. You can disable the logs of the agent by setting DT_LOGLEVELCON to off. If logging is disabled, Dynatrace support requests that you first enable logging to diagnose any agent issues effectively. You must then restart the app, which is necessary for the change to take effect. For other log levels, consult the Dynatrace support team.
Caution
We strongly recommend that you don't override the default logging behavior provided by Azure Spring Apps for Dynatrace. If you do, the logging scenarios previously described are blocked, and the log file(s) may be lost. For example, you shouldn't output the DT_LOGLEVELFILE environment variable to your applications.
Dynatrace OneAgent upgrade
The Dynatrace OneAgent auto-upgrade is disabled and is upgraded quarterly with the JDK. Agent upgrade may affect the following scenarios:
- Existing applications using Dynatrace OneAgent before upgrade are unchanged, but require restart or redeploy to engage the new version of Dynatrace OneAgent.
- Applications created after upgrade use the new version of Dynatrace OneAgent.
Virtual network injection instance outbound traffic configuration
For a virtual network injection instance of Azure Spring Apps, you need to make sure the outbound traffic for Dynatrace communication endpoints is configured correctly for Dynatrace OneAgent. For information about how to get communicationEndpoints, see Deployment API - GET connectivity information for OneAgent. For more information, see Customer responsibilities for running Azure Spring Apps in a virtual network.
Dynatrace support model
For information about limitations when deploying Dynatrace OneAgent in application-only mode, see the Cloud application platforms section of OneAgent platform and capability support matrix.
Next steps
Use Application Insights Java In-Process Agent in Azure Spring Apps
