Configure diagnostic logging for Azure AI Search
Resource-level diagnostic logs provide insight into operations that occur in your Azure AI Search resource. In contrast, activity logs provide an insight into the operations performed on each Azure resource in the subscription from the outside, known as the control plane. Activity logging is enabled automatically, and often
This article explains how to enable resource-level diagnostic logging and how to find information about system and user operations on an Azure AI Search resource.
Prerequisites
- An Azure Log Analytics workspace in the same subscription.
Enable diagnostic logging
Diagnostic logging is available through Azure Monitor. Although some logging, like Activity Logs and built-in metrics, is reported automatically with no upfront configuration, resource-level logs about in-service operations and data access require that you create a diagnostic setting and specify a storage option.
Sign in to the Azure portal and navigate to your search service.
Under Monitoring > Diagnostic settings, select Add diagnostic setting.
Provide a name that identifies the service and level of logging, such as "my-search-service-all-logs" or "my-search-service-audit-logs".
Under Logs, choose a category:
- Audit logs capture user or app interactions with data or the settings of the service, but don't include user or groups identities.
- Operation logs capture information about operations on a search service.
- allLogs collect everything.
Verbose logging can be expensive to store and complex to manage and store. You might want to start with allLogs and then switch to more scoped logging if it meets your information requirements. For more information about these categories, see Diagnostic settings in Azure Monitor.
For a destination, we recommend Send to Log Analytics workspace so that you can run Kusto queries against the data. There should be a workspace available
Save the settings.
Repeat these steps if you require a more comprehensive data collection strategy.
Each diagnostic setting you create requires its own data sink. If you use the Azure portal to review logs, the first diagnostic setting is used by default. You can navigate to specific workspaces for visualization support.
Note
If you're using key-based authentication, Azure AI Search can't monitor individual user access to content on the search service. If you require this level of monitoring, you need to implement it in your client application.
View logs in Log Analytics
Follow these instructions to explore log analytics data for your resource.
Under Monitoring, select Logs. Query hub opens by default. You can try the available queries, or close the hub and open a query window in KQL mode to run queries written in the Kusto Query Language (KQL).
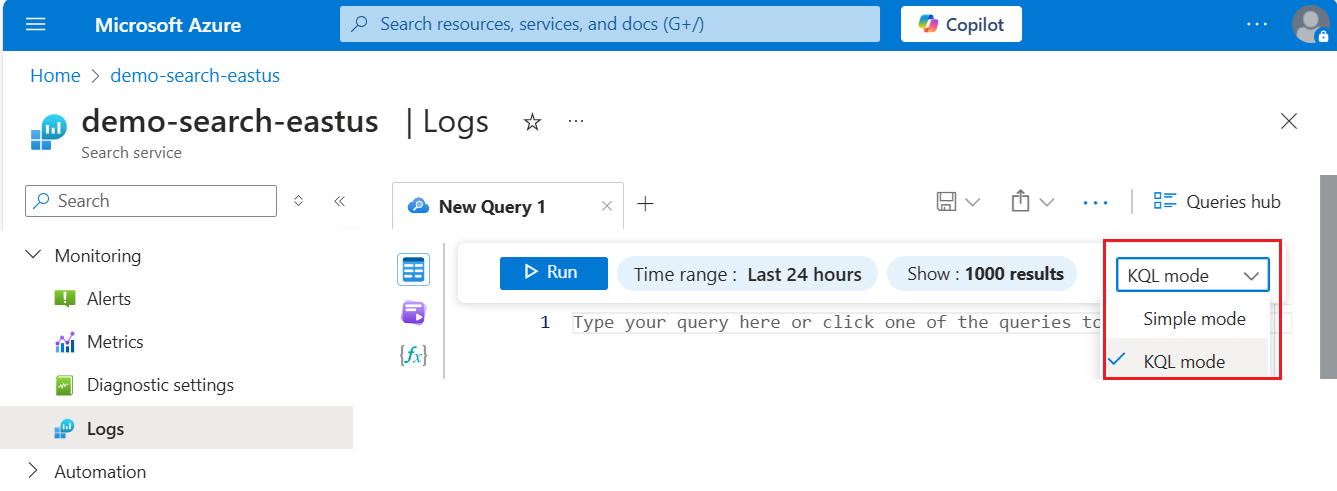
In a query window, you can run Kusto queries against your logs.
Sample queries
Here are a few basic Kusto queries you can use to explore your log data.
Run this query for all diagnostic logs from Azure AI Search services over the specified time period:
AzureDiagnostics
| where ResourceProvider == "MICROSOFT.SEARCH"
Run this query to see the 10 most recent logs:
AzureDiagnostics
| where ResourceProvider == "MICROSOFT.SEARCH"
| take 10
Run this query to group operations by Resource:
AzureDiagnostics
| where ResourceProvider == "MICROSOFT.SEARCH" |
summarize count() by Resource
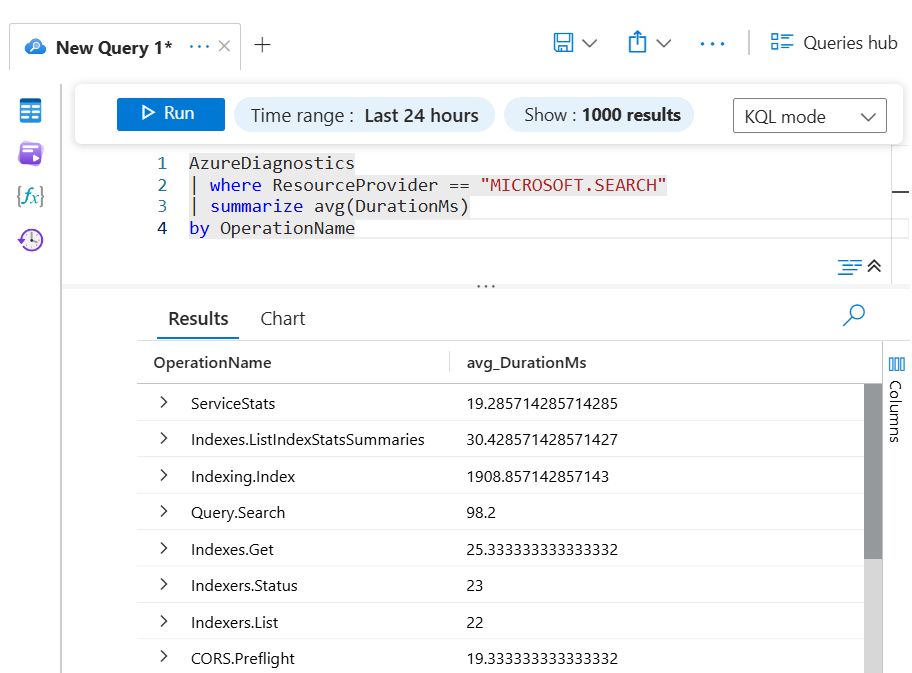
Run this query to find the average time it takes to perform an operation:
AzureDiagnostics
| where ResourceProvider == "MICROSOFT.SEARCH"
| summarize avg(DurationMs)
by OperationName
Run this query to view the volume of operations over time split by OperationName with counts binned for every 10 seconds.
AzureDiagnostics
| where ResourceProvider == "MICROSOFT.SEARCH"
| summarize count()
by bin(TimeGenerated, 10s), OperationName
| render areachart kind=unstacked