Tutorial: Customize the dashboard and manage devices in Azure IoT Central
In this tutorial, you learn how to customize the dashboard in your Azure IoT Central in-store analytics application. Application operators can use the customized dashboard to run the application and manage the attached devices.
In this tutorial, you learn how to:
- Customize image tiles on the dashboard
- Arrange tiles to modify the layout
- Add telemetry tiles to display conditions
- Add property tiles to display device details
- Add command tiles to run commands
Prerequisites
Before you begin, complete the Create an in-store analytics application in Azure IoT Central tutorial.
Change the dashboard name
After you've created your condition-monitoring application, you can edit its default dashboard. You can also create more dashboards.
The first step in customizing the application dashboard is to change the name:
Go to the Azure IoT Central My apps page.
Open the condition-monitoring application that you created.
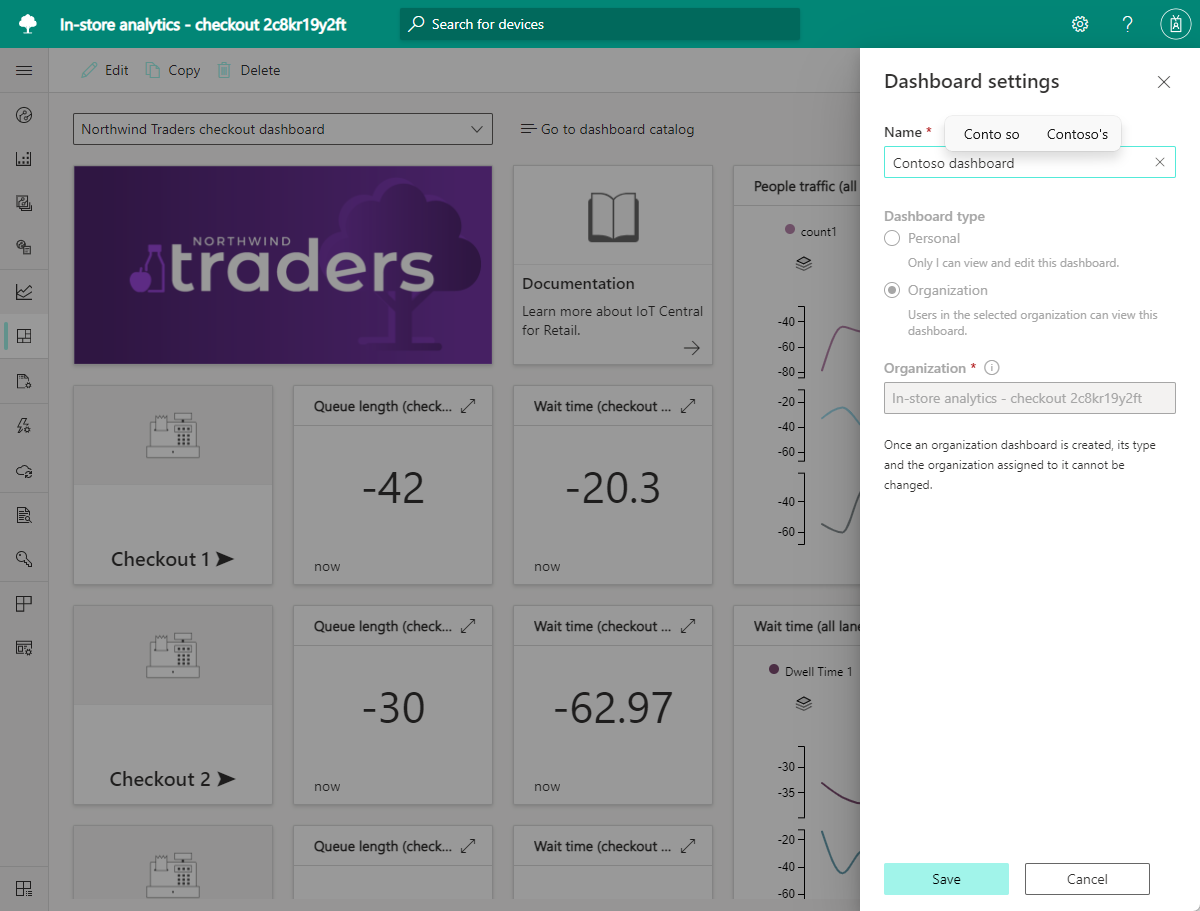
Select Dashboard settings, enter a name for your dashboard, and then select Save.
Customize image tiles on the dashboard
An Azure IoT Central application dashboard consists of one or more tiles. A tile is a rectangular container for displaying content on a dashboard. You associate various types of content with tiles, and you can drag, drop, and resize tiles to customize the dashboard layout.
There are several types of tiles for displaying content:
- Image tiles contain images, and you can add a URL that lets you select the image.
- Label tiles display plain text.
- Markdown tiles contain formatted content and let you set an image, a URL, a title, and Markdown code that renders as HTML.
- Telemetry, property, or command tiles display device-specific data.
In this section, you customize image tiles on the dashboard.
To customize the image tile that displays a brand image on the dashboard:
Select Edit on the dashboard toolbar.
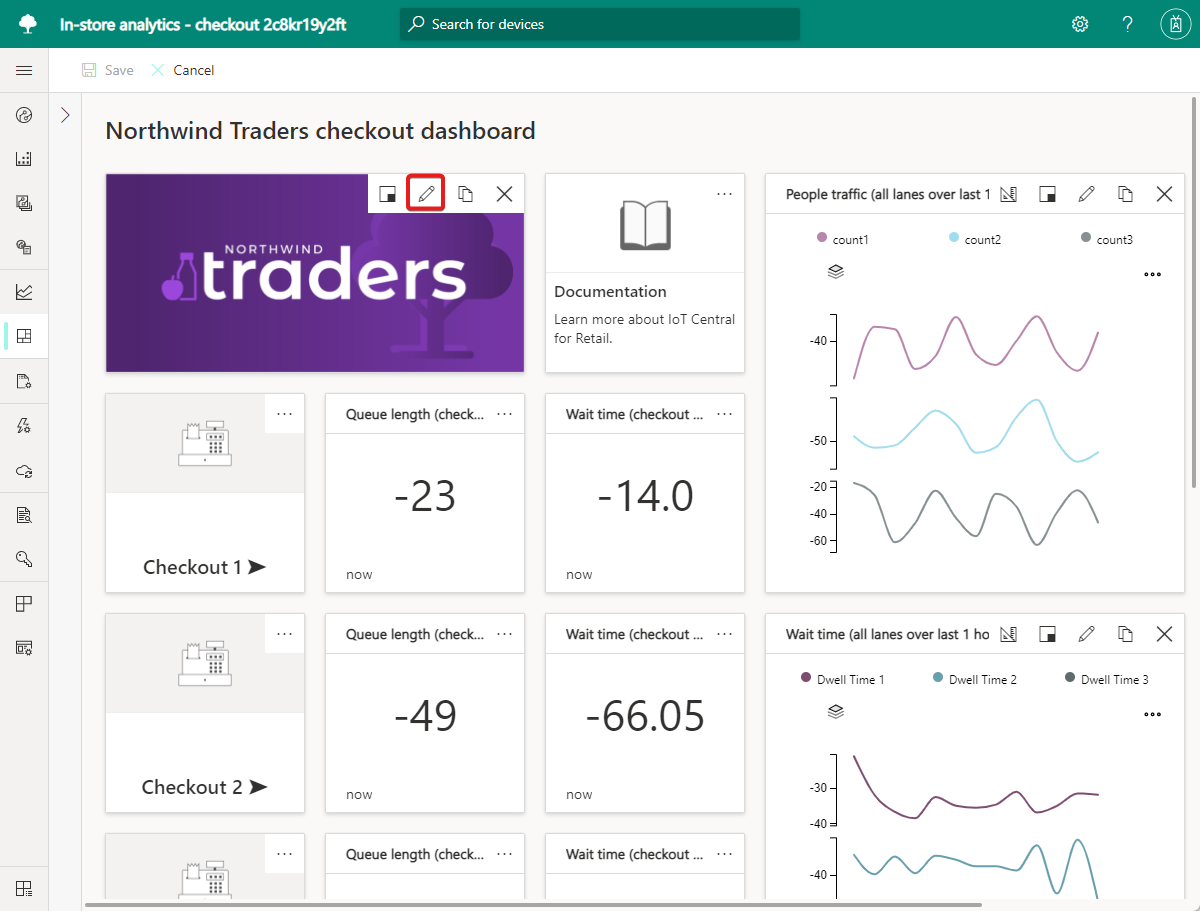
Select Edit on the image tile that displays the Northwind Traders brand image.
Change the Title. The title appears when you hover over the image.
Select Image. A window opens where you can upload a custom image or, optionally, specify a URL for the image.
Select Update.
Optionally, on the Documentation tile, select Configure, and then specify a URL that links to support content.
To customize the image tile that displays a map of the sensor zones in the store:
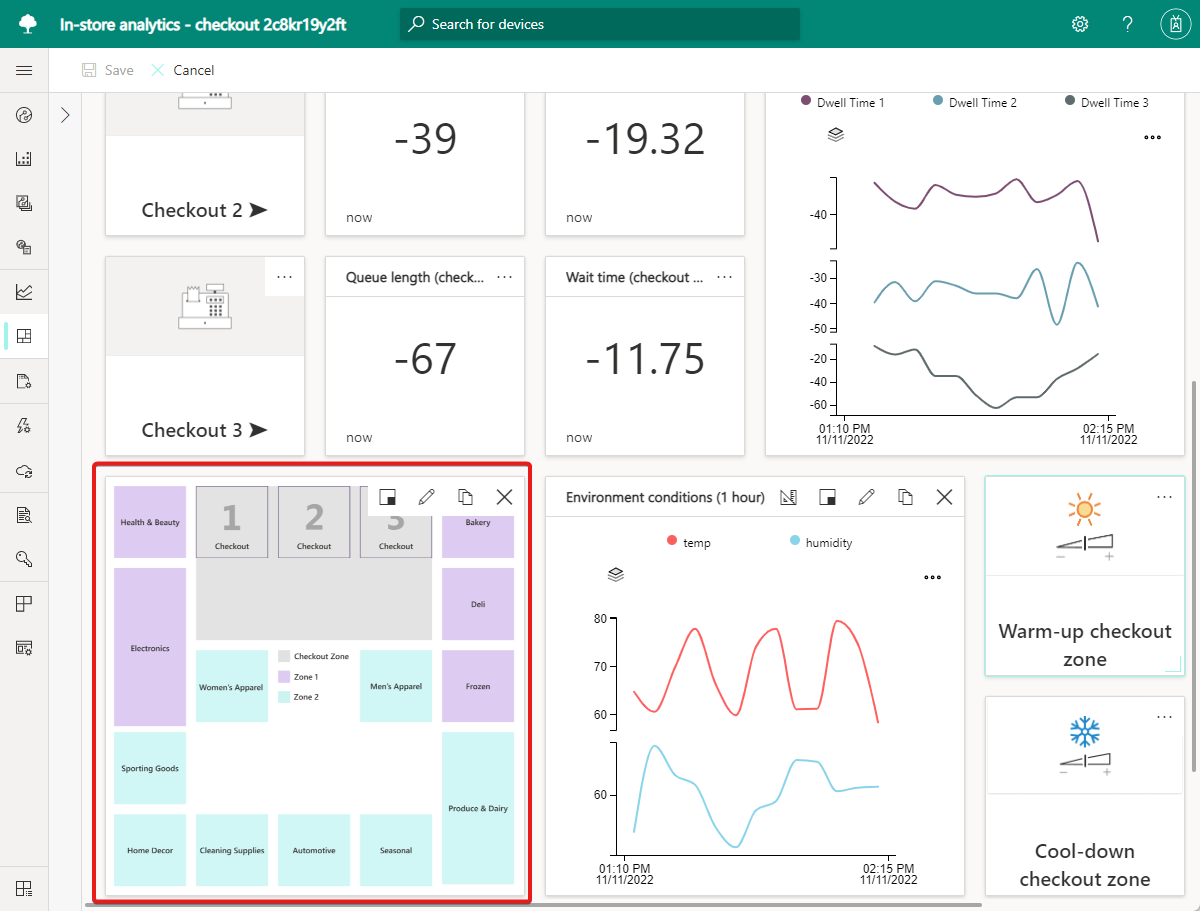
On the image tile that displays the default store zone map, select Configure.
Select Image, and then upload a custom image of a store zone map.
Select Update.
The example Contoso store map shows four zones: two checkout zones, a zone for apparel and personal care, and a zone for groceries and deli.
In this tutorial, you associate sensors with these zones to provide telemetry.
Arrange tiles to modify the layout
A key step in customizing a dashboard is to rearrange the tiles to create a useful view. Application operators use the dashboard to visualize device telemetry, manage devices, and monitor conditions in a store.
Azure IoT Central simplifies the application builder task of creating a dashboard. By using the dashboard edit mode, you can quickly add, move, resize, and delete tiles.
The In-store analytics - checkout application template also simplifies the task of creating a dashboard. The template provides a working dashboard layout, with sensors connected, and tiles that display checkout line counts and environmental conditions.
In this section, you rearrange the dashboard tiles in the In-store analytics - checkout application template to create a custom layout.
To remove tiles that you don't plan to use in your application:
Select Edit on the dashboard toolbar.
For each of the following tiles, which the Contoso store dashboard doesn't use, select the ellipsis (...), and then select Delete:
- Back to all zones
- Visit store dashboard
- Warm-up checkout zone
- Cool-down checkout zone
- Occupancy sensor settings
- Thermostat settings
- Wait time
- Environment conditions
- Checkout 3: All three tiles associated with it
Select Save. Removing unused tiles frees space on the edit page, and it simplifies the dashboard view for operators.
After you've removed the unused tiles, rearrange the remaining tiles to create an organized layout. The new layout includes space for tiles that you add later.
To rearrange the remaining tiles:
Select Edit.
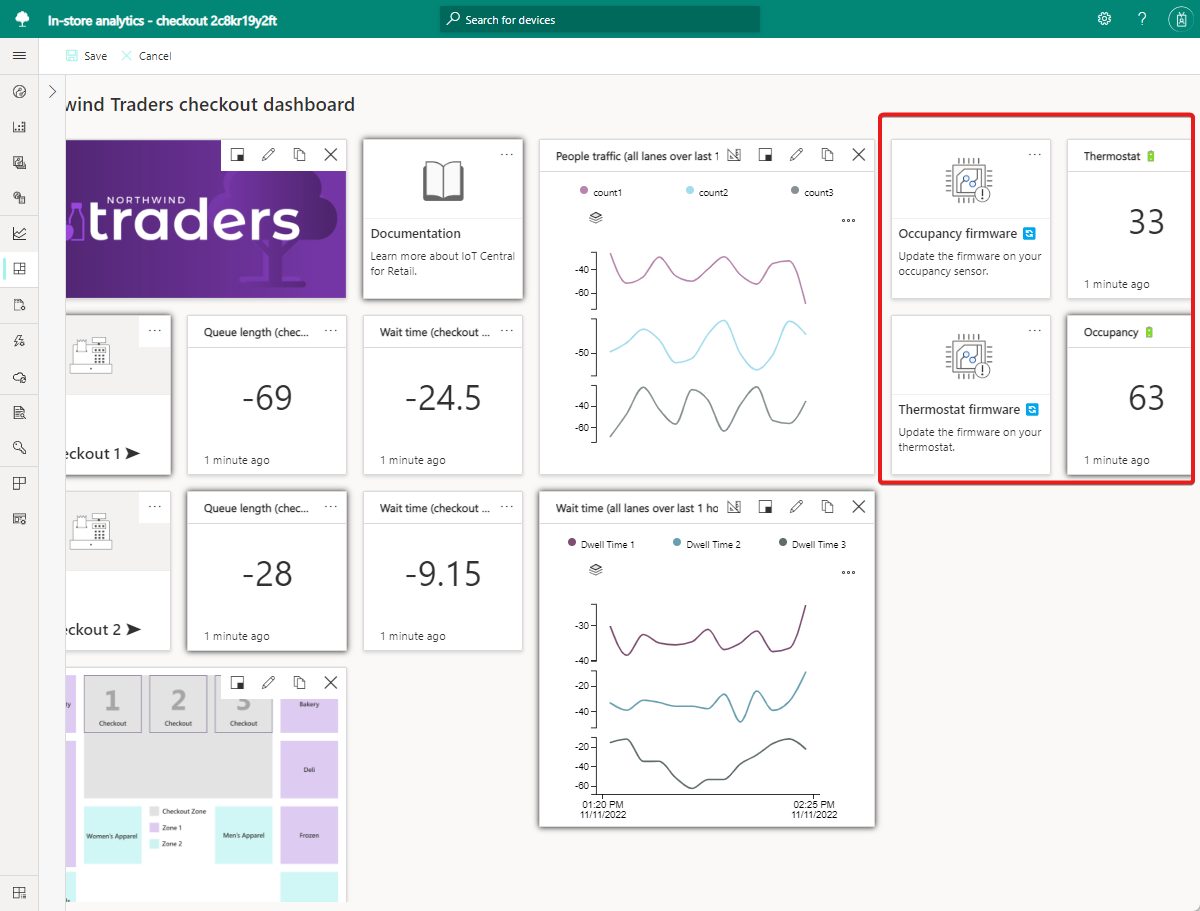
Drag the Occupancy firmware tile to the right of the Occupancy battery tile.
Drag the Thermostat firmware tile to the right of the Thermostat battery tile.
Select Save.
View your layout changes.
Add telemetry tiles to display conditions
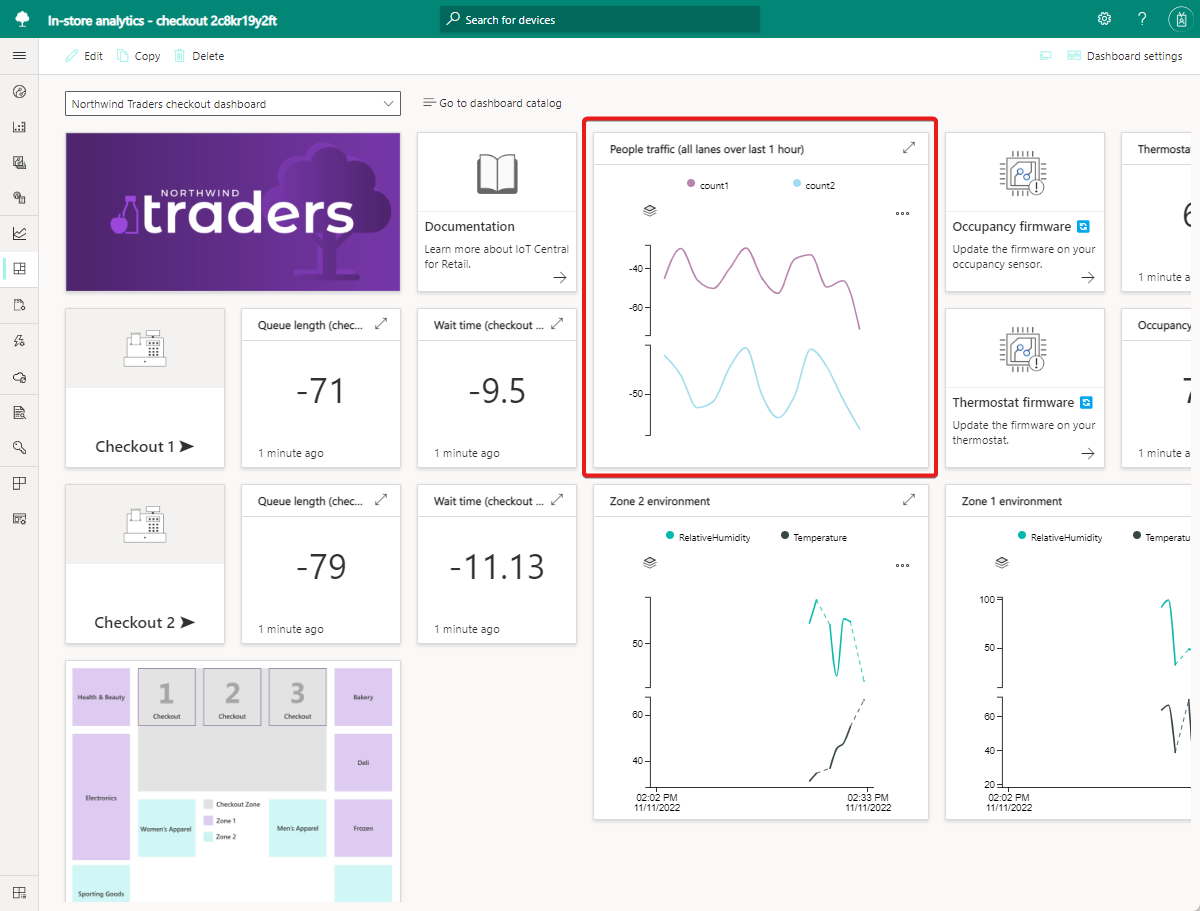
After you customize the dashboard layout, you're ready to add tiles to display telemetry. To create a telemetry tile, select a device template and device instance, then select device-specific telemetry to display in the tile. The In-store analytics - checkout application template includes several telemetry tiles on the dashboard. The four tiles in the two checkout zones display telemetry from the simulated occupancy sensor. The People traffic tile shows counts in the two checkout zones.
In this section, you add two more telemetry tiles to display environmental telemetry from the RuuviTag sensors you added in the Create an in-store analytics application in Azure IoT Central tutorial.
To add tiles to display environmental data from the RuuviTag sensors:
Select Edit.
In the Device template list, select RuuviTag.
Select a Device instance of one of the two RuuviTag sensors. In the Contoso store example, select Zone 1 Ruuvi to create a telemetry tile for Zone 1.
In the Telemetry list, select Relative humidity and Temperature, the telemetry items that are displayed for each zone on the tile.
Select Add tile. This new tile displays combined humidity and temperature telemetry for the selected sensor.
On the new tile for the RuuviTag sensor, select Configure.
Change the Title to Zone 1 environment.
Select Update.
Repeat steps 1 through 8 to create a tile for the second sensor instance. For Title, enter Zone 2 environment, and then select Update configuration.
Drag the tile titled Zone 2 environment to below the Thermostat firmware tile.
Drag the tile titled Zone 1 environment to below the People traffic tile.
Select Save. The dashboard displays zone telemetry in the two new tiles.
To edit the People traffic tile to show telemetry for only two checkout zones:
Select Edit.
On the People traffic tile, select Edit.
Remove the count3 telemetry.
Select Update.
Select Save. The updated dashboard displays counts for only your two checkout zones, which are based on the simulated occupancy sensor.
Add command tiles to run commands
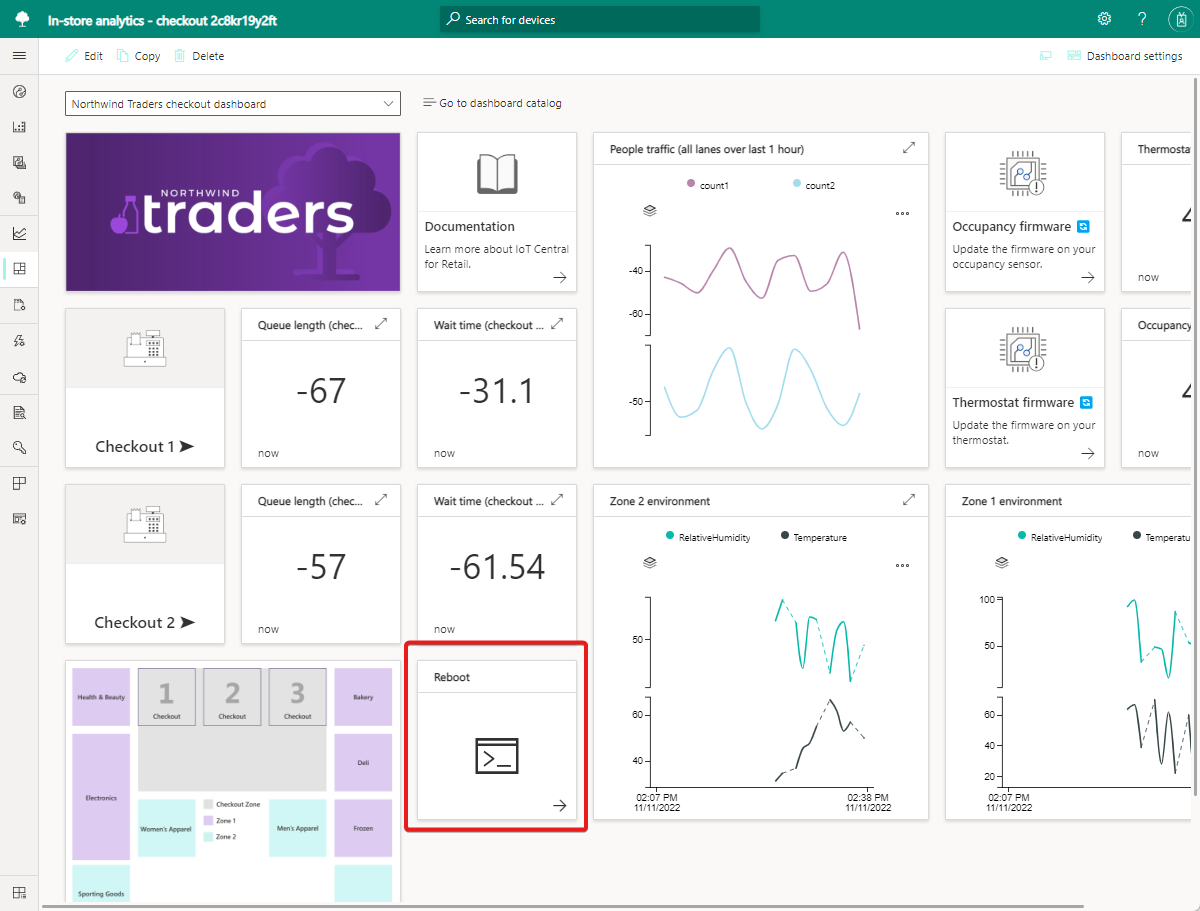
Application operators also use the dashboard to manage devices by running commands. You can add command tiles to the dashboard that execute predefined commands on a device. In this section, you add a command tile to enable operators to reboot the Rigado gateway.
To add a command tile to reboot the gateway:
Select Edit.
In the Device template list, select C500. It's the template for the Rigado C500 gateway.
Select the gateway instance in Device instance.
Select the Reboot command.
Select Add tile.
Select Save.
View your completed Contoso dashboard.
Optionally, select the Reboot tile to run the reboot command on your gateway.
Clean up resources
If you don't plan to complete any further IoT Central quickstarts or tutorials, you can delete your IoT Central application:
- In your IoT Central application, navigate to Application > Management.
- Select Delete and then confirm your action.
