Monitoring with Azure Managed Prometheus and Grafana
Important
Azure HDInsight on AKS retired on January 31, 2025. Learn more with this announcement.
You need to migrate your workloads to Microsoft Fabric or an equivalent Azure product to avoid abrupt termination of your workloads.
Important
This feature is currently in preview. The Supplemental Terms of Use for Microsoft Azure Previews include more legal terms that apply to Azure features that are in beta, in preview, or otherwise not yet released into general availability. For information about this specific preview, see Azure HDInsight on AKS preview information. For questions or feature suggestions, please submit a request on AskHDInsight with the details and follow us for more updates on Azure HDInsight Community.
Cluster and service Monitoring is integral part of any organization. Azure HDInsight on AKS comes with integrated monitoring experience with Azure services. In this article, we use managed Prometheus service with Azure Grafana dashboards for monitoring.
Azure Managed Prometheus is a service that monitors your cloud environments. The monitoring is to maintain their availability and performance and workload metrics. It collects data generated by resources in your Azure instances and from other monitoring tools. The data is used to provide analysis across multiple sources.
Azure Managed Grafana is a data visualization platform built on top of the Grafana software by Grafana Labs. It's built as a fully managed Azure service operated and supported by Microsoft. Grafana helps you bring together metrics, logs, and traces into a single user interface. With its extensive support for data sources and graphing capabilities, you can view and analyze your application and infrastructure telemetry data in real-time.
This article covers the details of enabling the monitoring feature in HDInsight on AKS.
Prerequisites
- An Azure Managed Prometheus workspace. You can think of this workspace as a unique Azure Monitor logs environment with its own data repository, data sources, and solutions. For the instructions, see Create an Azure Managed Prometheus workspace.
- Azure Managed Grafana workspace. For the instructions, see Create an Azure Managed Grafana workspace.
- An HDInsight on AKS cluster. Currently, you can use Azure Managed Prometheus with the following HDInsight on AKS cluster types:
- Apache Spark™
- Apache Flink®
- Trino
For the instructions on how to create an HDInsight on AKS cluster, see Get started with Azure HDInsight on AKS.
Enabling Azure Managed Prometheus and Grafana
The Azure Managed Prometheus and Grafana Monitoring must be configured at cluster pool level to enable it at cluster level. You need to consider various stages while enabling the Monitoring Solution.
| # | Scenario | Enable | Disable |
|---|---|---|---|
| 1 | Cluster Pool -During Creation | Not Supported |
Default |
| 2 | Cluster Pool – Post Creation | Supported |
Not Supported |
| 3 | Cluster – During Creation | Supported |
Default |
| 4 | Cluster – Post Creation | Supported |
Supported |
During cluster pool creation
Currently, Managed Prometheus CANNOT be enabled during Cluster Pool creation time. You can configure it post cluster pool creation.
Post cluster pool creation
Monitoring can be enabled from the Integrations tab on an existing Cluster Pool View available in Azure portal. You can use pre created workspaces or create a new one while your'e configuring the monitoring for the cluster pool.
Use precreated workspace
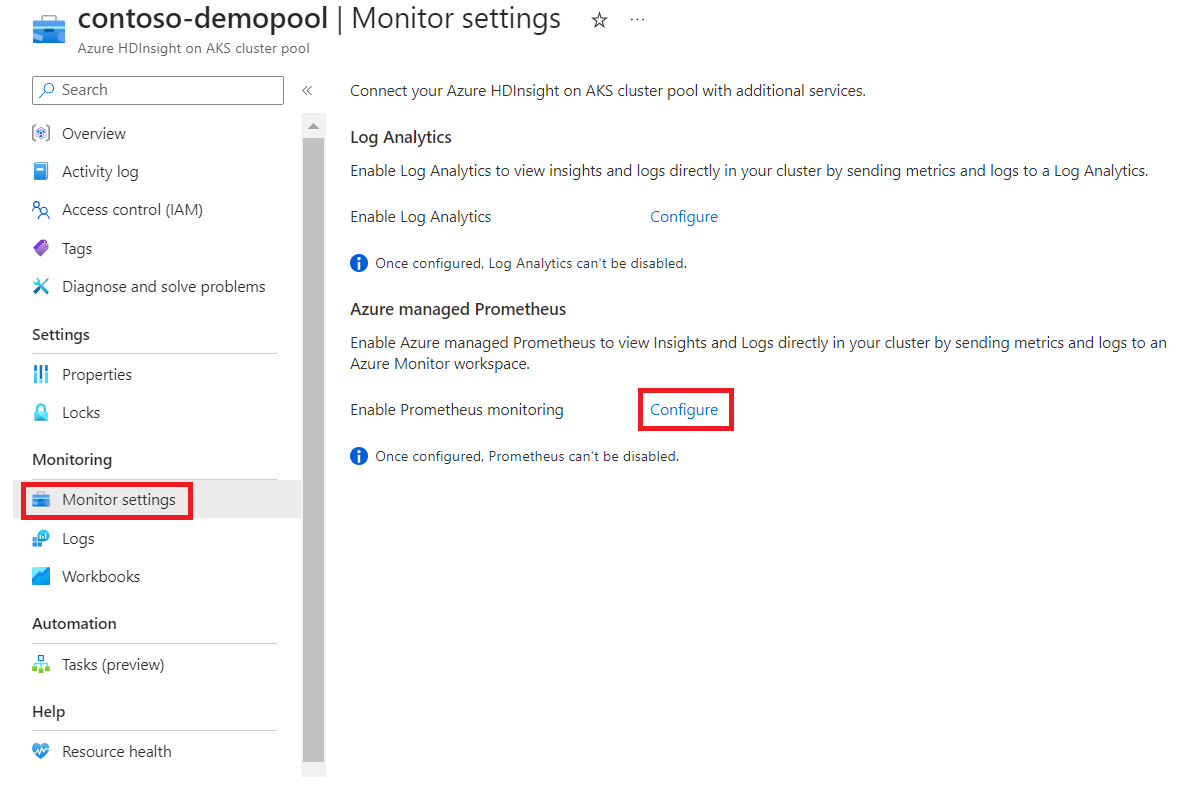
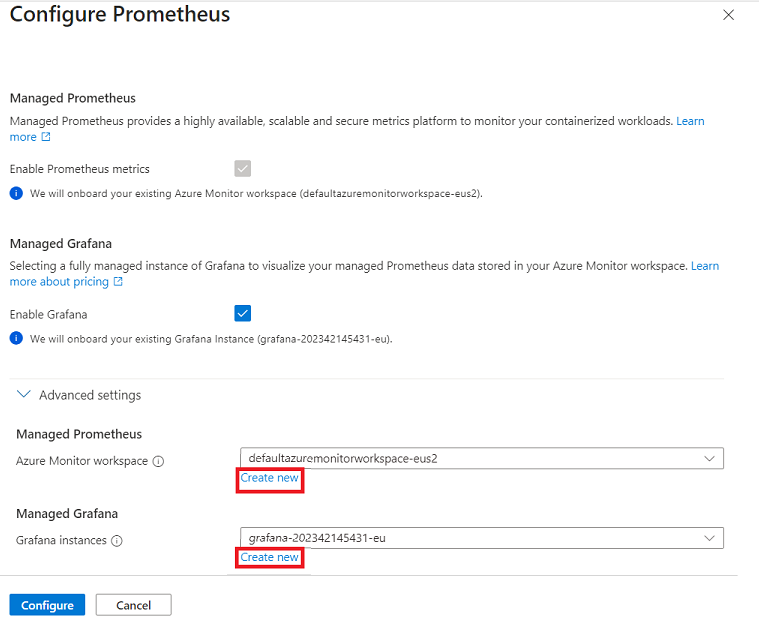
Click on configure to enable Azure Prometheus monitoring.
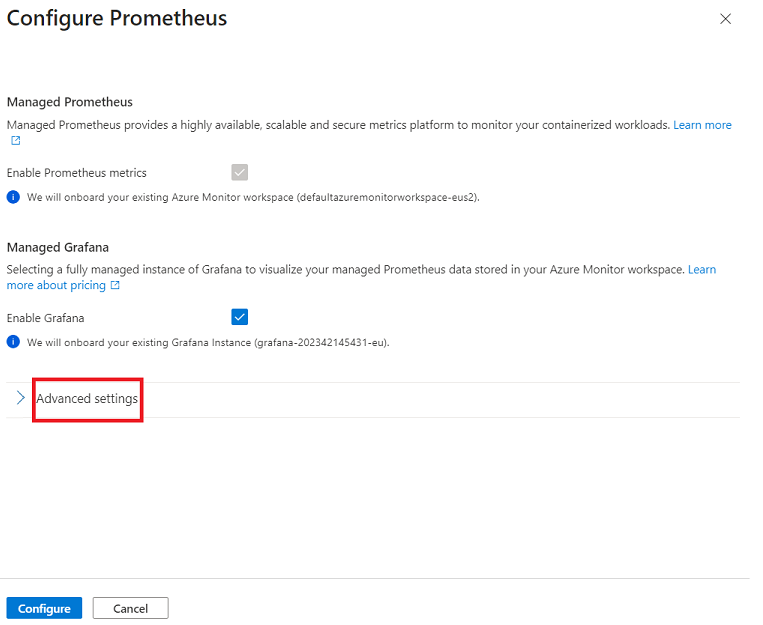
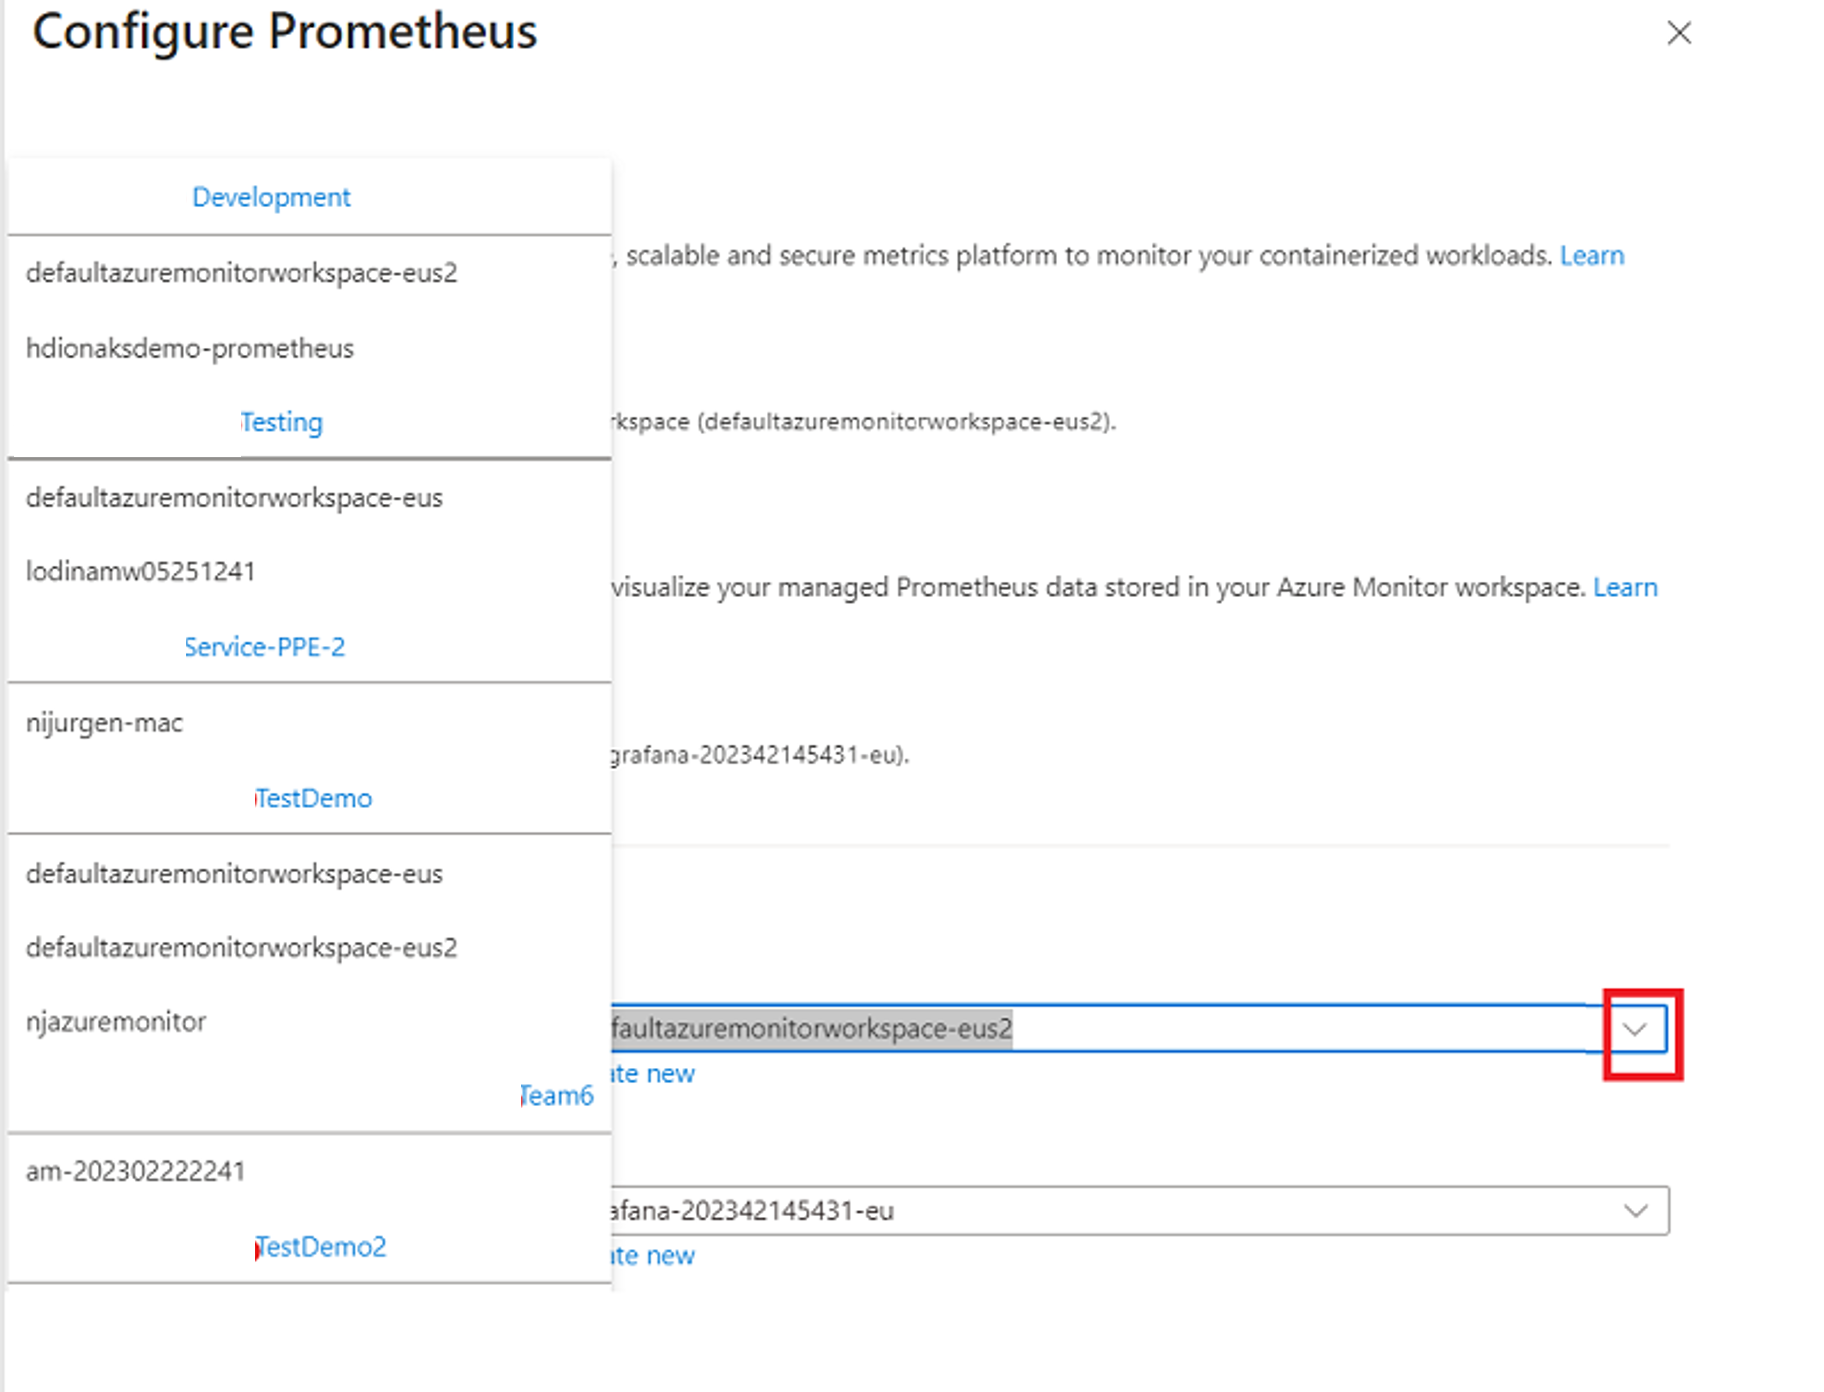
Click on Advanced Settings to attach your pre created workspaces.
Create Azure Prometheus and Grafana Workspace while enabling Monitoring in Cluster Pool
You can create the workspaces from the HDI on AKS cluster pool page.
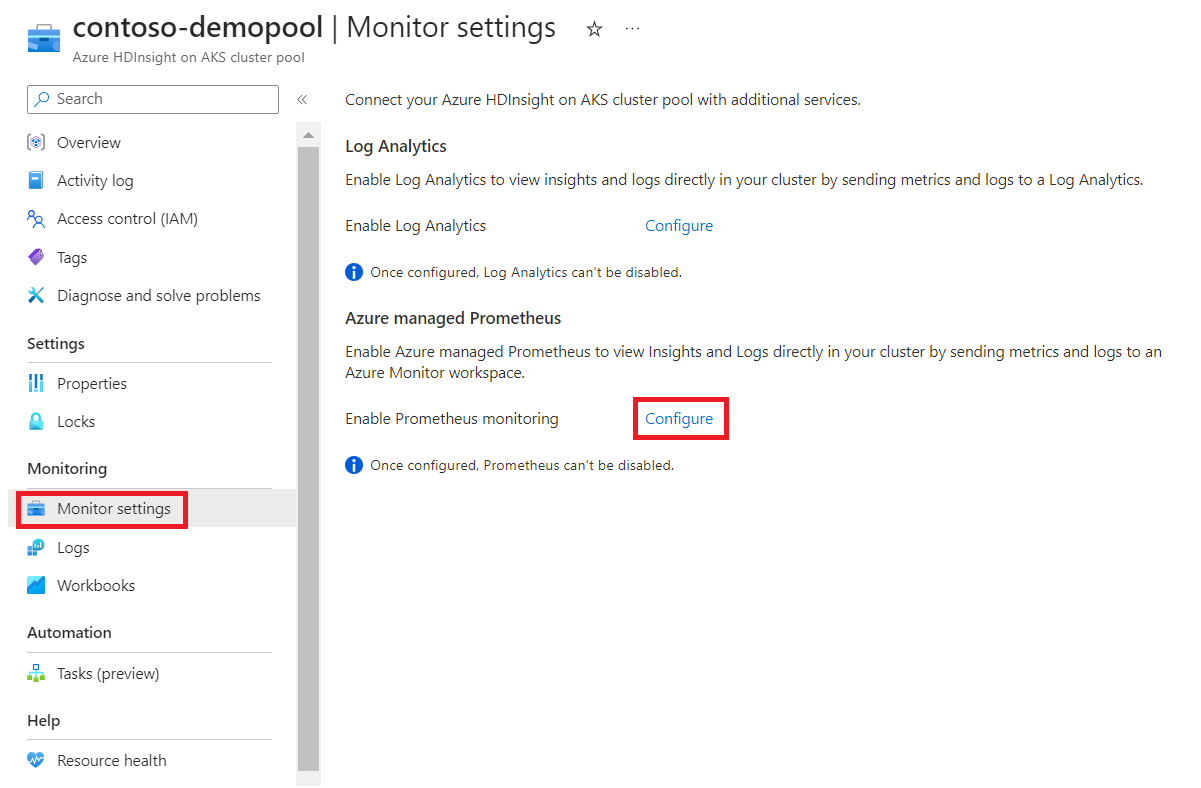
Click on Configure next to the Azure Prometheus option.
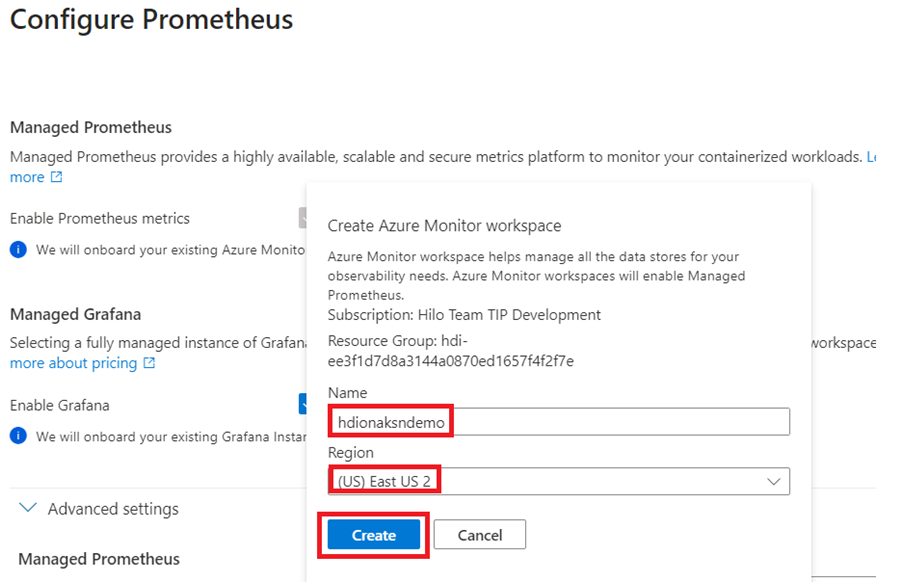
Click on Create New workspace for Azure Managed Prometheus.
Fill in the name, region and click on Create for Prometheus.
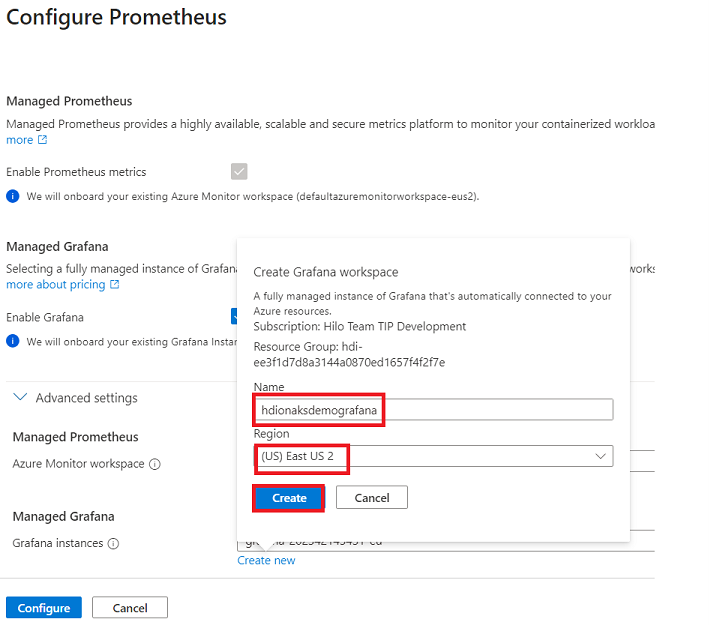
Click on Create New workspace for Azure Managed Grafana.
Fill in Name, Region and click on Create for Grafana.
Note
- Managed Grafana can be enabled only if Managed Prometheus is enabled.
- Once Azure Managed Prometheus workspace and Azure Managed Grafana workspace is enabled from the HDInsight on AKS cluster pool, it cannot be disabled from the cluster pool again. It must be disabled from the cluster level.
During cluster creation
Enable Azure Managed Prometheus during cluster creation
Once the cluster pool is created and the Azure Managed Prometheus enabled, user must create a HDI on AKS cluster in the same cluster pool.
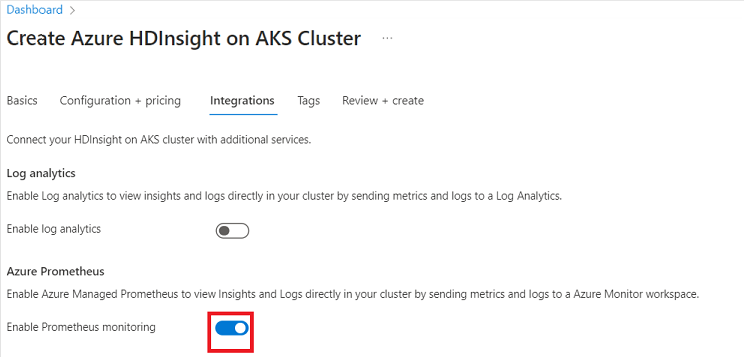
During the cluster creation process, navigate to the Integration page and enable Azure Prometheus.
Post cluster creation
You can also enable Azure Managed Prometheus post HDI on AKS cluster creation
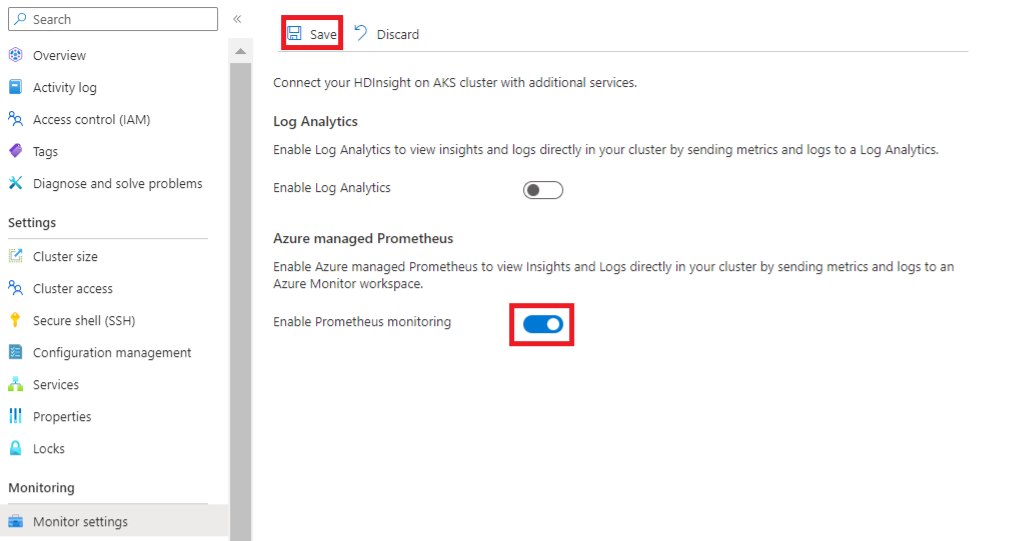
Navigate to the Integrations tab in the cluster page.
Enable Azure Prometheus Monitoring with the toggle button and click on Save.
Note
Similarly, if you need to disable Azure Prometheus monitoring can be done by disabling the toggle button and click on Save.
Enabling required permissions
For viewing Azure Managed Prometheus and Azure Managed Grafana from the HDInsight on AKS portal, you need to have certain permissions as follows.
User permission: For viewing Azure Managed Grafana, “Grafana Viewer” role is required for the user in the Azure Managed Grafana workspace, Access control (IAM). View how to grant user access, here.
Open the Grafana workspace configured in the cluster pool.
Select the Role as Grafana Viewer
Select the username who is accessing the Grafana dashboard.
Select the user and click on Review+ Assign
Note
If user is pre-creating Azure Managed Prometheus the Grafana Identity requires additional permission of Monitoring Reader.
In the Grafana workspace page (the one linked to the cluster) provides Monitoring reader permission in Identity tab.
Click on Add role assignment.
Select the following parameters
- Scope as Subscription
- The subscription name.
- Role as Monitoring Reader
Note
For viewing other roles for Grafana users see here.
View metrics
We are using an Apache Spark™ cluster as an example in this case, assuming few jobs are executed in the cluster, in order to have the metrics.
Review the following steps to use the Grafana sample templates:
Download the sample template from here for the respective workloads (download the Apache Spark template in this case).
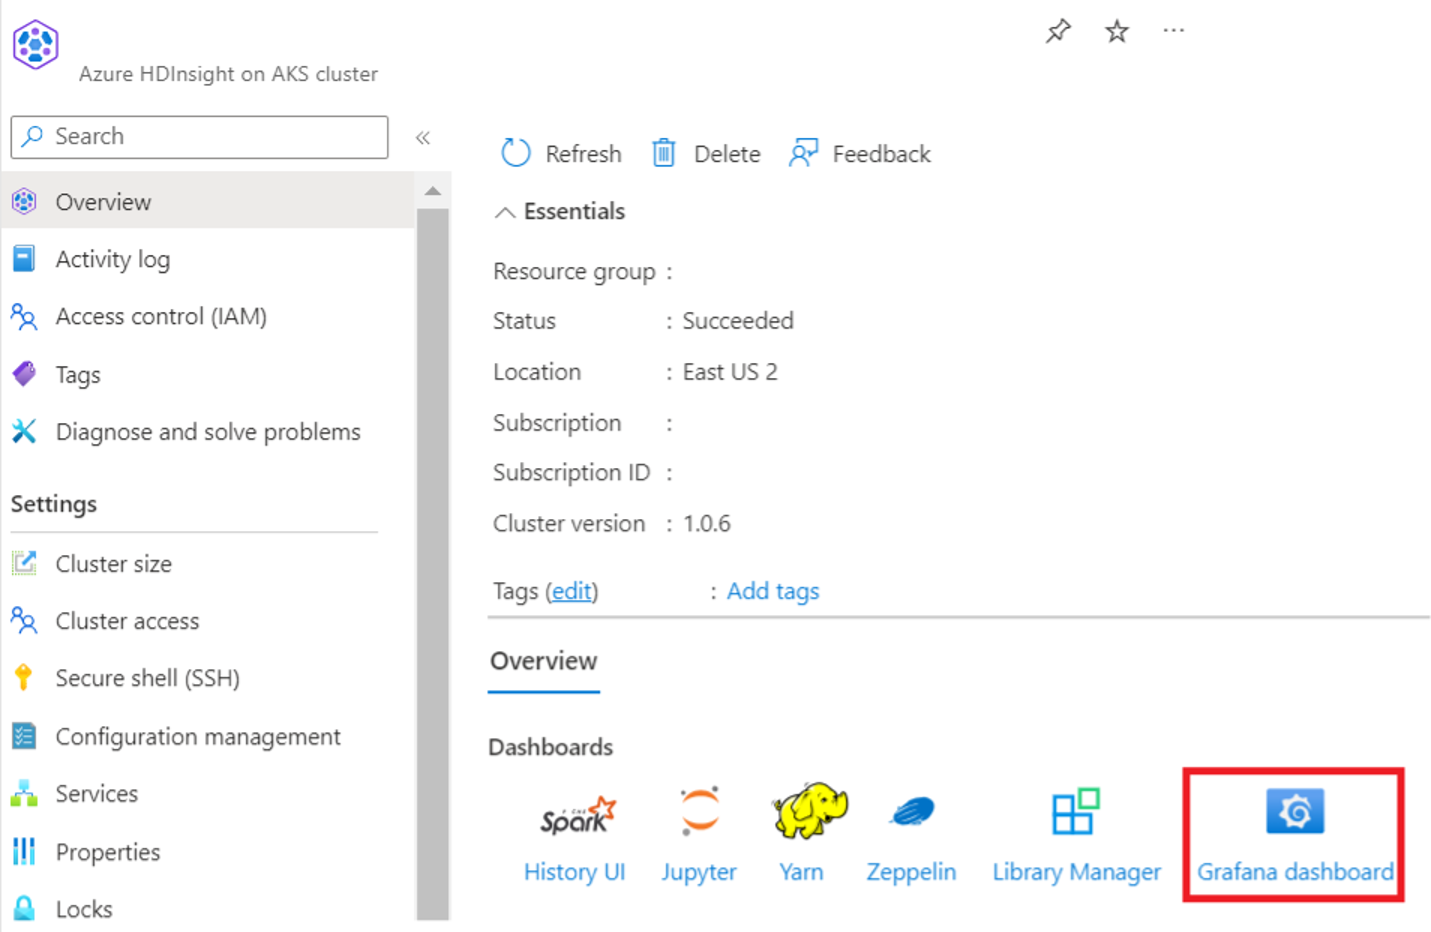
Login to the Grafana Dashboard from your cluster.
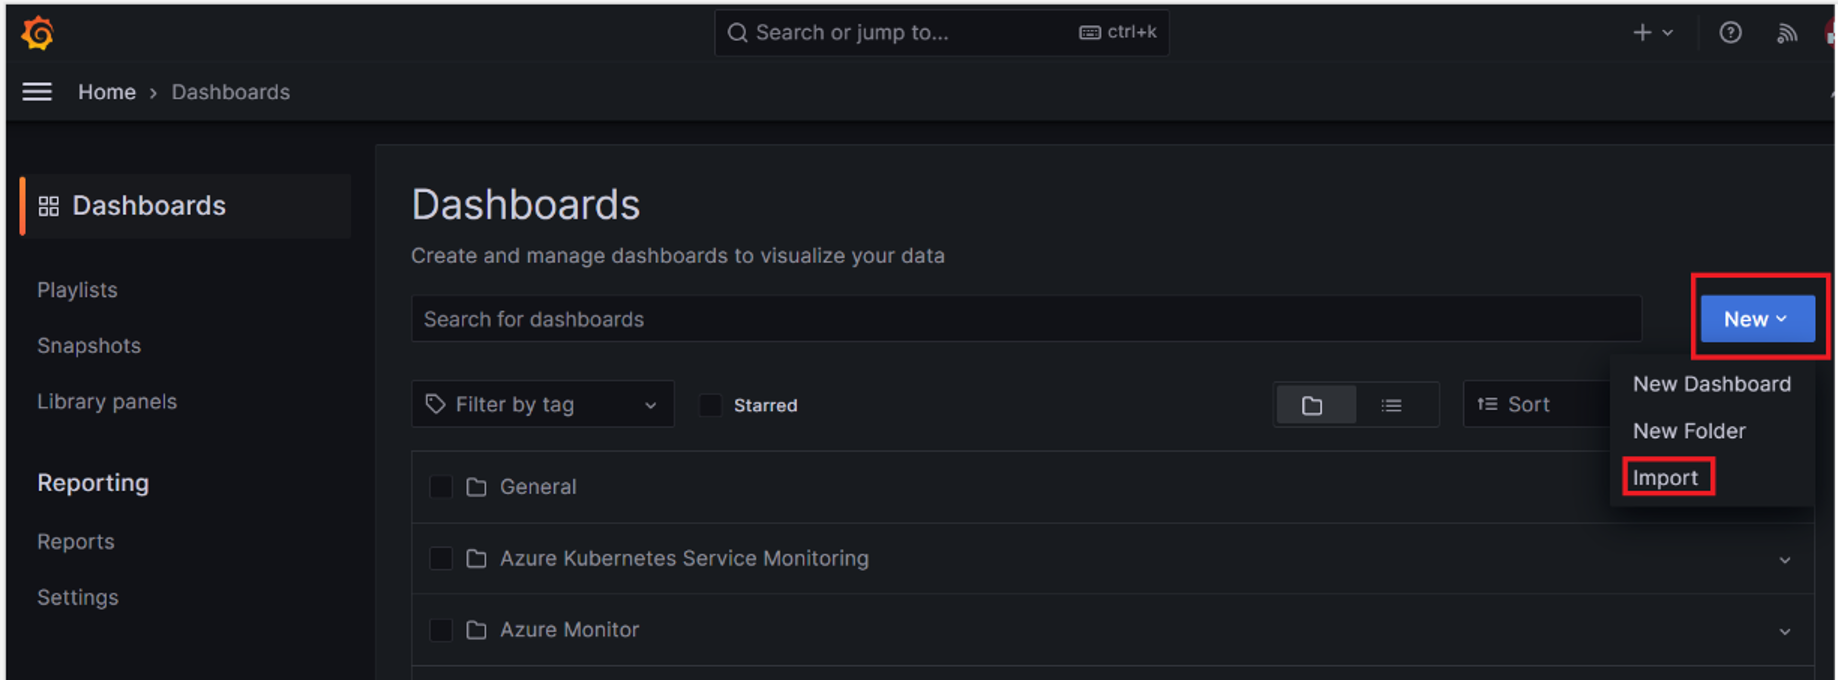
Once the Grafana Dashboard page is opened, click on New > Import
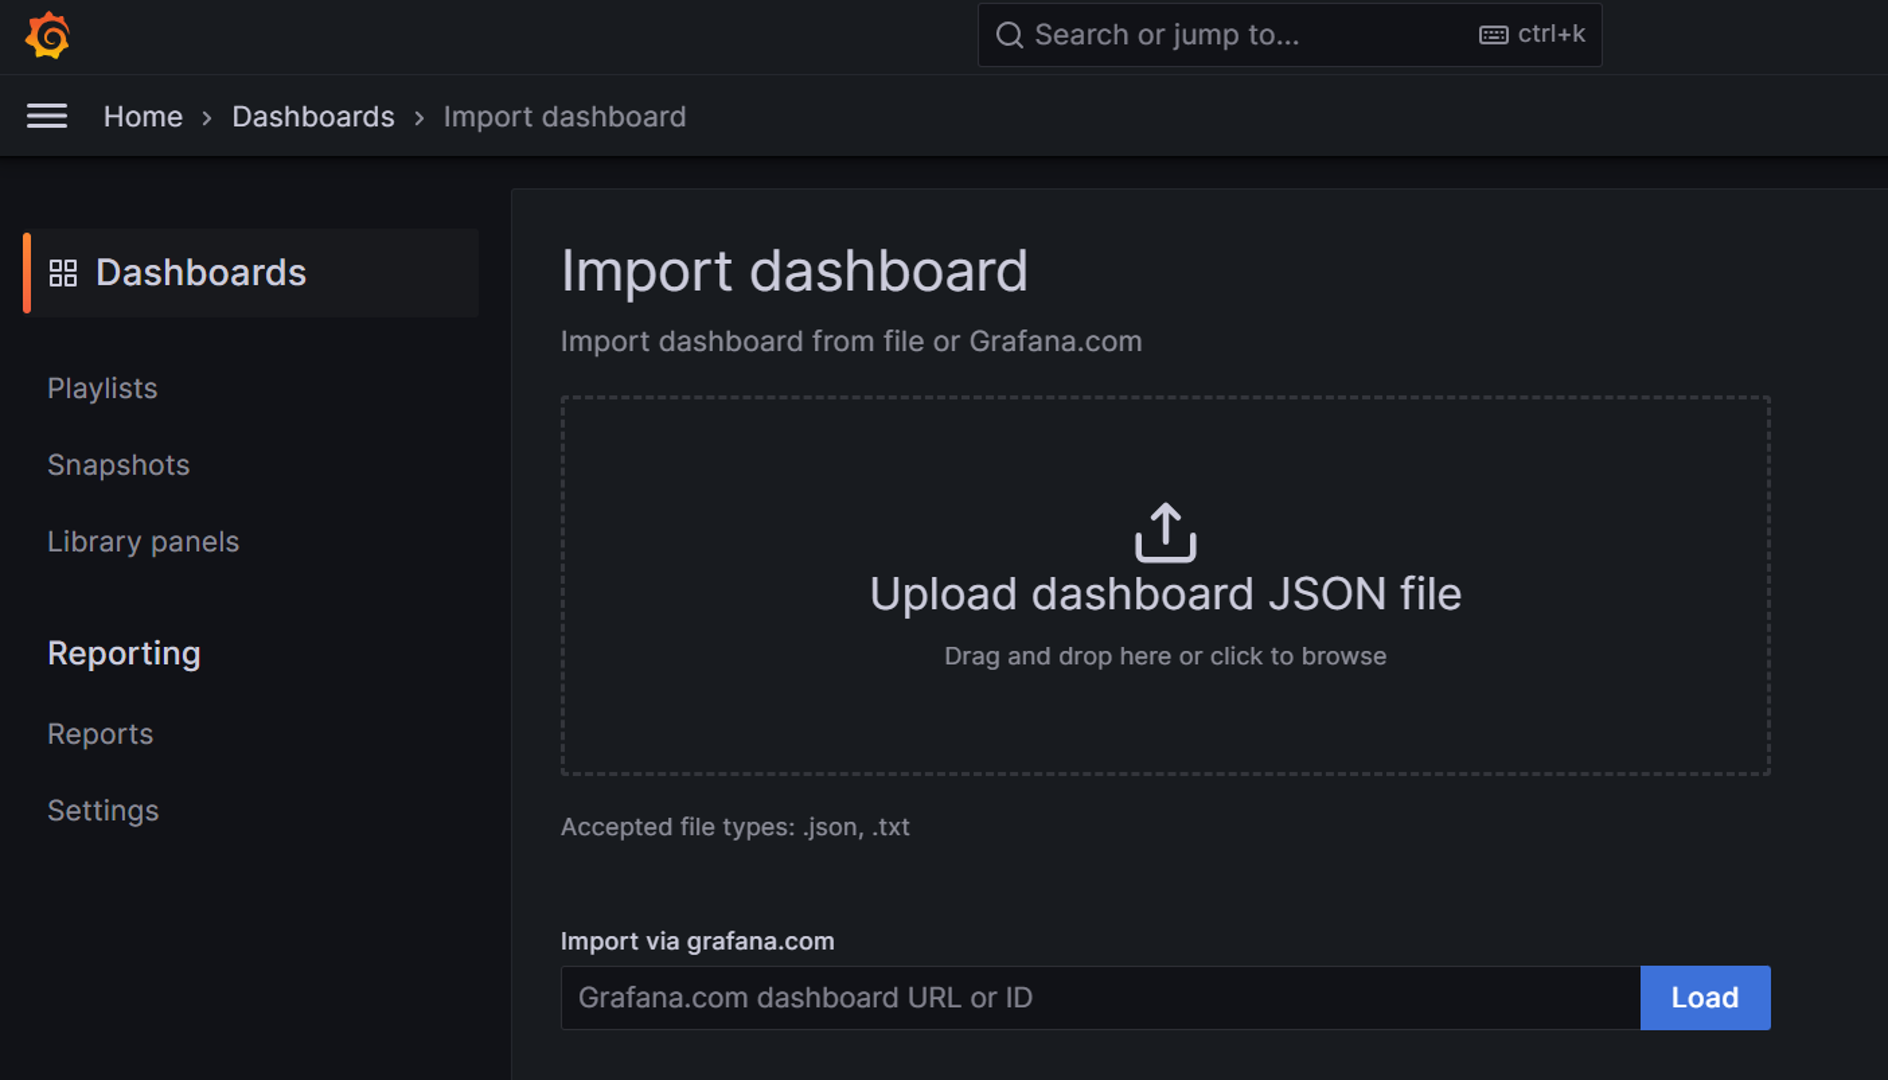
Click on the Upload Dashboard JSON file and upload the Apache Spark Grafana template that you have downloaded and click on Import.
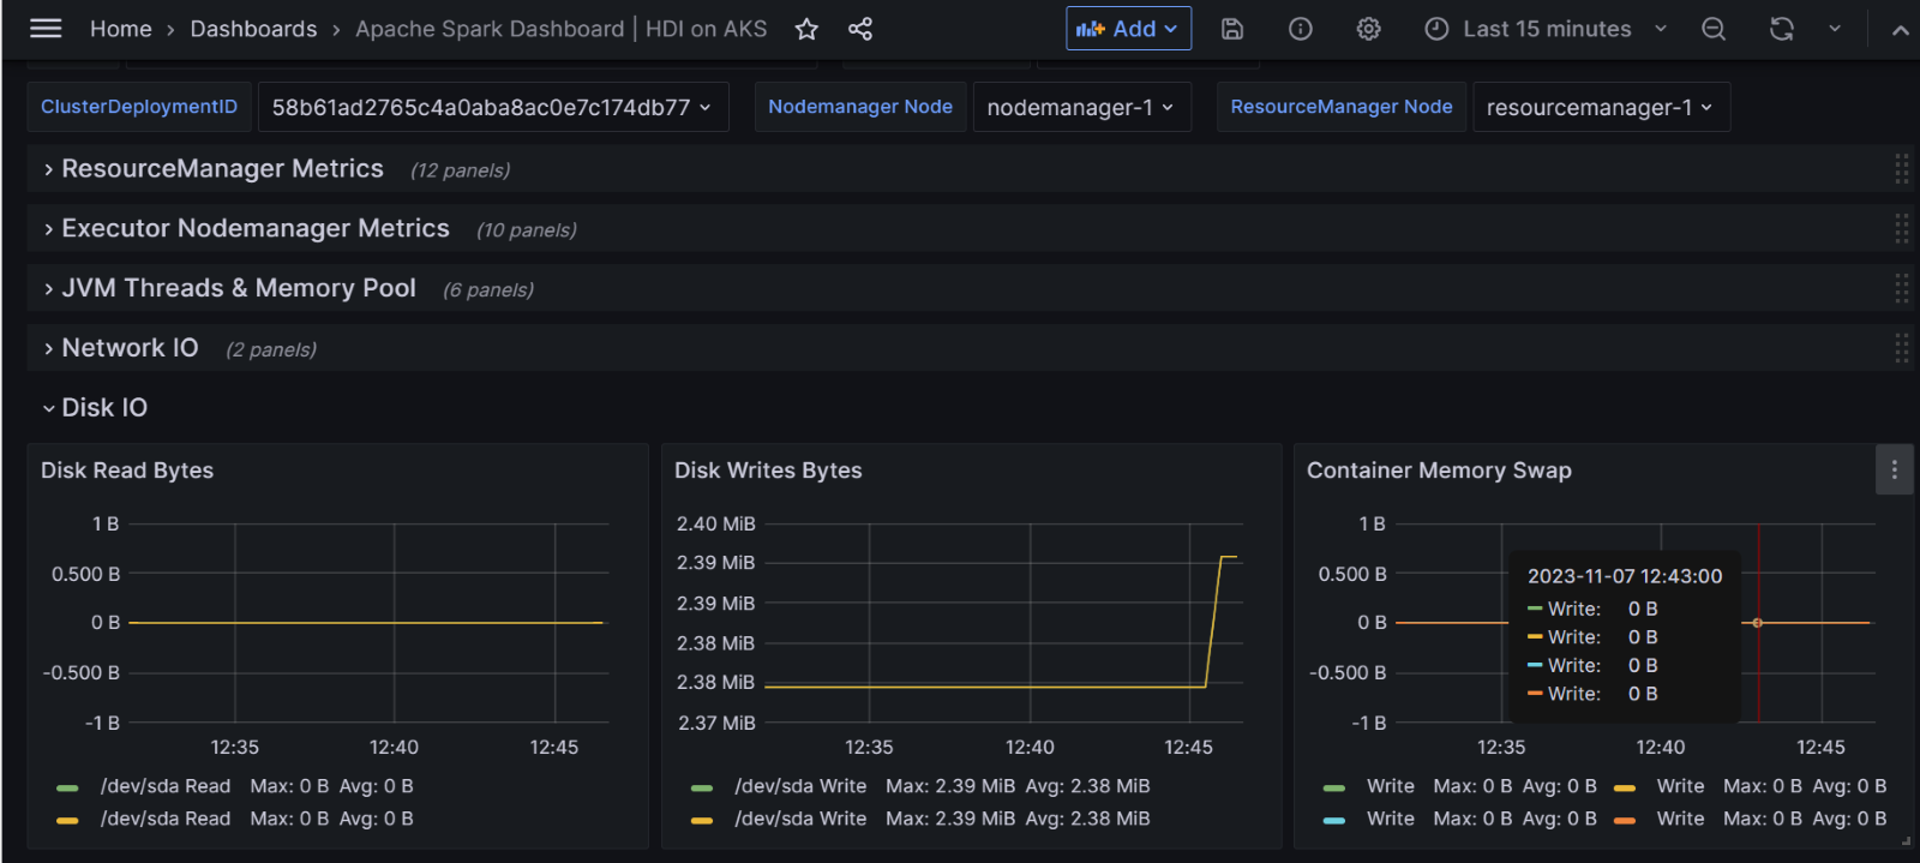
After the upload is complete, you can click on the dashboard to view the metrics.
Reference
- Apache, Apache Spark, Spark, and associated open source project names are trademarks of the Apache Software Foundation (ASF).
