Get started with the Java Diagnostic Agent
This article describes how to get started using the Java Diagnostic Agent. It also describes the Java Diagnostic Tool on AKS plugin for IntelliJ IDEA.
The Java Diagnostic Agent is a Java agent for troubleshooting a Java process. It doesn't need to rebuild, redeploy, or restart an application. Currently, it supports adding logs around a function in a Java class. When the function is called, the log is printed along with a calculation of the total time consumed by the function.
Prerequisites
diag4j installed in your cluster.
Java LTS version 11, 17, or 21.
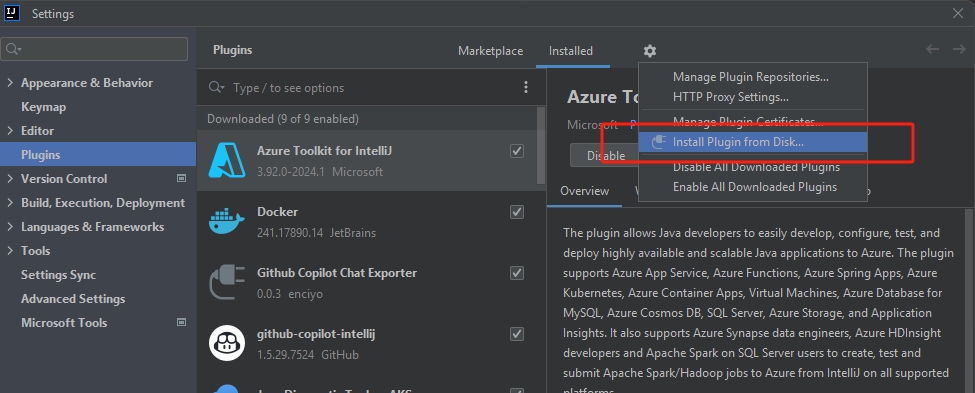
The IntelliJ IDEA plugin, installed locally through Settings > Plugins > Install Plugin from Disk.
Java applications to troubleshoot with. For more information, see Deploy Spring Boot Application to the Azure Kubernetes Service.

Establish port forwarding
Use the following command to establish port forwarding to the agent service:
kubectl port-forward svc/diag4j-agent-service -n <namespace> <port>:8080
Use the Java Diagnostic Tool on AKS plugin for IntelliJ IDEA
You can use the Java Diagnostic Tool on AKS plugin to attach the Java Diagnostic Agent to the Java application running in a pod container on an Azure Kubernetes Service (AKS) cluster.
After you attach the agent, it enables you to perform troubleshooting tasks such as adding logs around a class function. You can use this log to test whether the function is executed and to calculate the total time spent in the function. This analysis can help you locate performance bottlenecks in your application.
The plugin configuration is shown on the Diagnostic tab. Here, you can do the following tasks:
- Configure the local port that forwards to the agent service.
- View the pods listed with
kubeconfigin your local environment. - Select Refresh to refresh the pod table. After you switch clusters, you should refresh the table to load the pods in new cluster.

Attach the agent
The pod container should have a /tmp folder, and it should have write permission to the /tmp folder.
To enable attaching the agent in the JVM, be sure not to add -XX:+DisableAttachMechanism to the JVM options.
The backend diagnostic server is closed after 6 hours.
To attach the agent, click the pod you want to attach the agent to, and then select the container. You can only attach the agent to one container in the pod. Then, wait for the attachment process to complete.

Set the active pod container
After you attach the agent successfully, you can use it for troubleshooting.
Multiple pods might have injected the agent, so you must set an active pod. In IntelliJ IDEA, on the Diagnostic tab, right-click a pod and then select Select as the active one.

Add logging around a class function
The configured log is automatically removed after 30 minutes.
You can use the tool to add logging around class functions, but not interfaces, constructors, and so on.
To add logging to a function, right-click it in the editor, then select Java Diagnostic > Add AroundLog, as shown in the following screenshot.

In this example, after you add the logging, you can call <host>/infor to see output similar to the following example before and after the function is called:
===== START ===== Method: updateInformation Start Time: 2024-12-12T07:37:55.404107848Z
Done with the validation
Done with the DB access
Done with the data filtering
===== END ===== Method: updateInformation End Time: 2024-12-12T07:37:55.404316940Z Total Time: 0 milliseconds
Remove all configured logs
To remove all the logs added by the agent, select Remove All AroundLogs.
Note
The backend Java agent is used by an ephemeral container in the pod. After the pod restarts, the agent is removed.
Troubleshooting
A timeout can occur when you attempt to attach the agent to a pod running on a node that hasn't already enabled the feature. The timeout can occur because the node must first retrieve the agent image, which causes a delay. When this occurs, you can select Refresh to check whether the agent has attached, or you can try attaching the agent again.
If the attachment fails, you can check the log named diagnostic-container-<hashcode> in the ephemeral container.
You can find information about the operations of the plugin in the logs under the pod container named diag4j-agent-service-<hashcode>.
Next step
Get started with the Spring Boot Admin component of the Java Diagnostic Tool (diag4j) on AKS