Configure ERSPAN (legacy) traffic mirroring with a Cisco switch
This article is one in a series of articles describing the deployment path for OT monitoring with Microsoft Defender for IoT.
This article provides high-level guidance for configuring encapsulated remote switched port analyzer (ERSPAN) traffic mirroring for a Cisco switch.
We recommend using your receiving router as the generic routing encapsulation (GRE) tunnel destination.
Prerequisites
Before you start, make sure that you understand your plan for network monitoring with Defender for IoT, and the SPAN ports you want to configure.
For more information, see Traffic mirroring methods for OT monitoring.
Configure the Cisco switch
The following code shows a sample ifconfig output for ERSPAN configured on a Cisco switch:
monitor session 1 type erspan-source
description ERSPAN to D4IoT
erspan-id 32                              # required, # between 1-1023
vrf default                               # required
destination ip 172.1.2.3                  # IP address of destination
source interface port-channel1 both       # Port(s) to be sniffed
filter vlan 1                             # limit VLAN(s) (optional)
no shut                                   # enable

monitor erspan origin ip-address 172.1.2.1 global
For more information, see CLI command reference from OT network sensors.
Validate traffic mirroring
After configuring traffic mirroring, make an attempt to receive a sample of recorded traffic (PCAP file) from the switch SPAN or mirror port.
A sample PCAP file will help you:
- Validate the switch configuration
- Confirm that the traffic going through your switch is relevant for monitoring
- Identify the bandwidth and an estimated number of devices detected by the switch
Use a network protocol analyzer application, such as Wireshark, to record a sample PCAP file for a few minutes. For example, connect a laptop to a port where you've configured traffic monitoring.
Check that Unicast packets are present in the recording traffic. Unicast traffic is traffic sent from address to another.
If most of the traffic is ARP messages, your traffic mirroring configuration isn't correct.
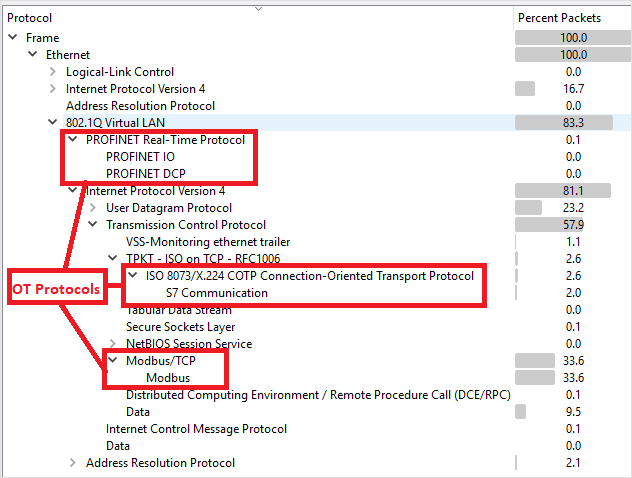
Verify that your OT protocols are present in the analyzed traffic.
For example:

Configure legacy ERSPAN in the CLI
Important
We don't recommend using legacy versions of the software as this might cause security issues for your system. If you're still using the legacy version the user needs to run specific CLI commands discussed in this section.
Configure setup via the CLI
Use this procedure to configure the following initial setup settings via CLI:
- Signing into the sensor console and setting a new admin user password
- Defining network details for your sensor
- Defining the interfaces you want to monitor
CLI Legacy
To configure a legacy ERSPAN tunneling interface in the CLI you need to use an adapted line of code. This code ensures that the legacy ERSPAN option is available in the CLI sensor configuration wizard.
A new legacy ERPSAN can only be configured if you have an existing interface configured.
To configure the legacy ERSPAN:
Log in to your sensor using a CLI interface with a cyberx or admin user.
Type
ERSPAN=1 python3 -m cyberx.config.configure.
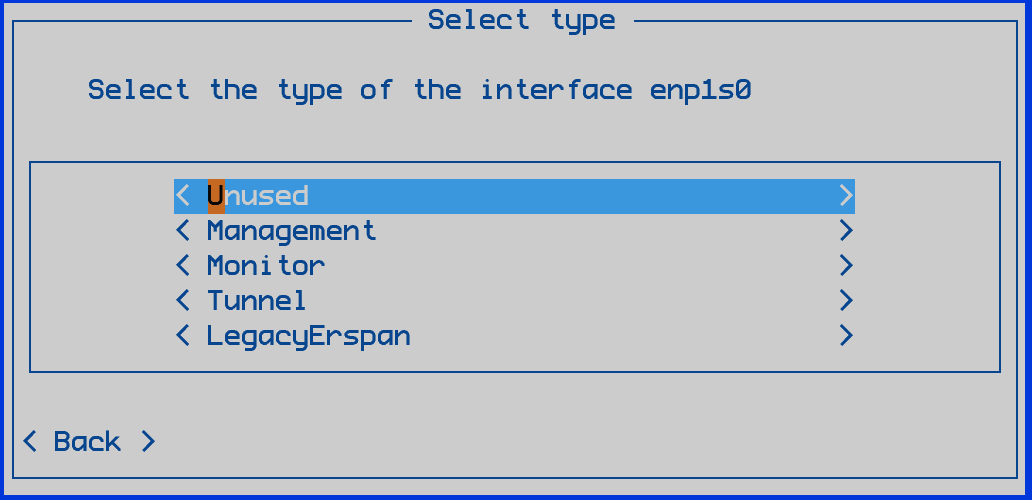
Select LegacyErspan and assign an interface.
Select Save.
