Monitor a SQL warehouse
You can monitor a SQL warehouse from the Databricks UI.
View SQL warehouse monitoring metrics
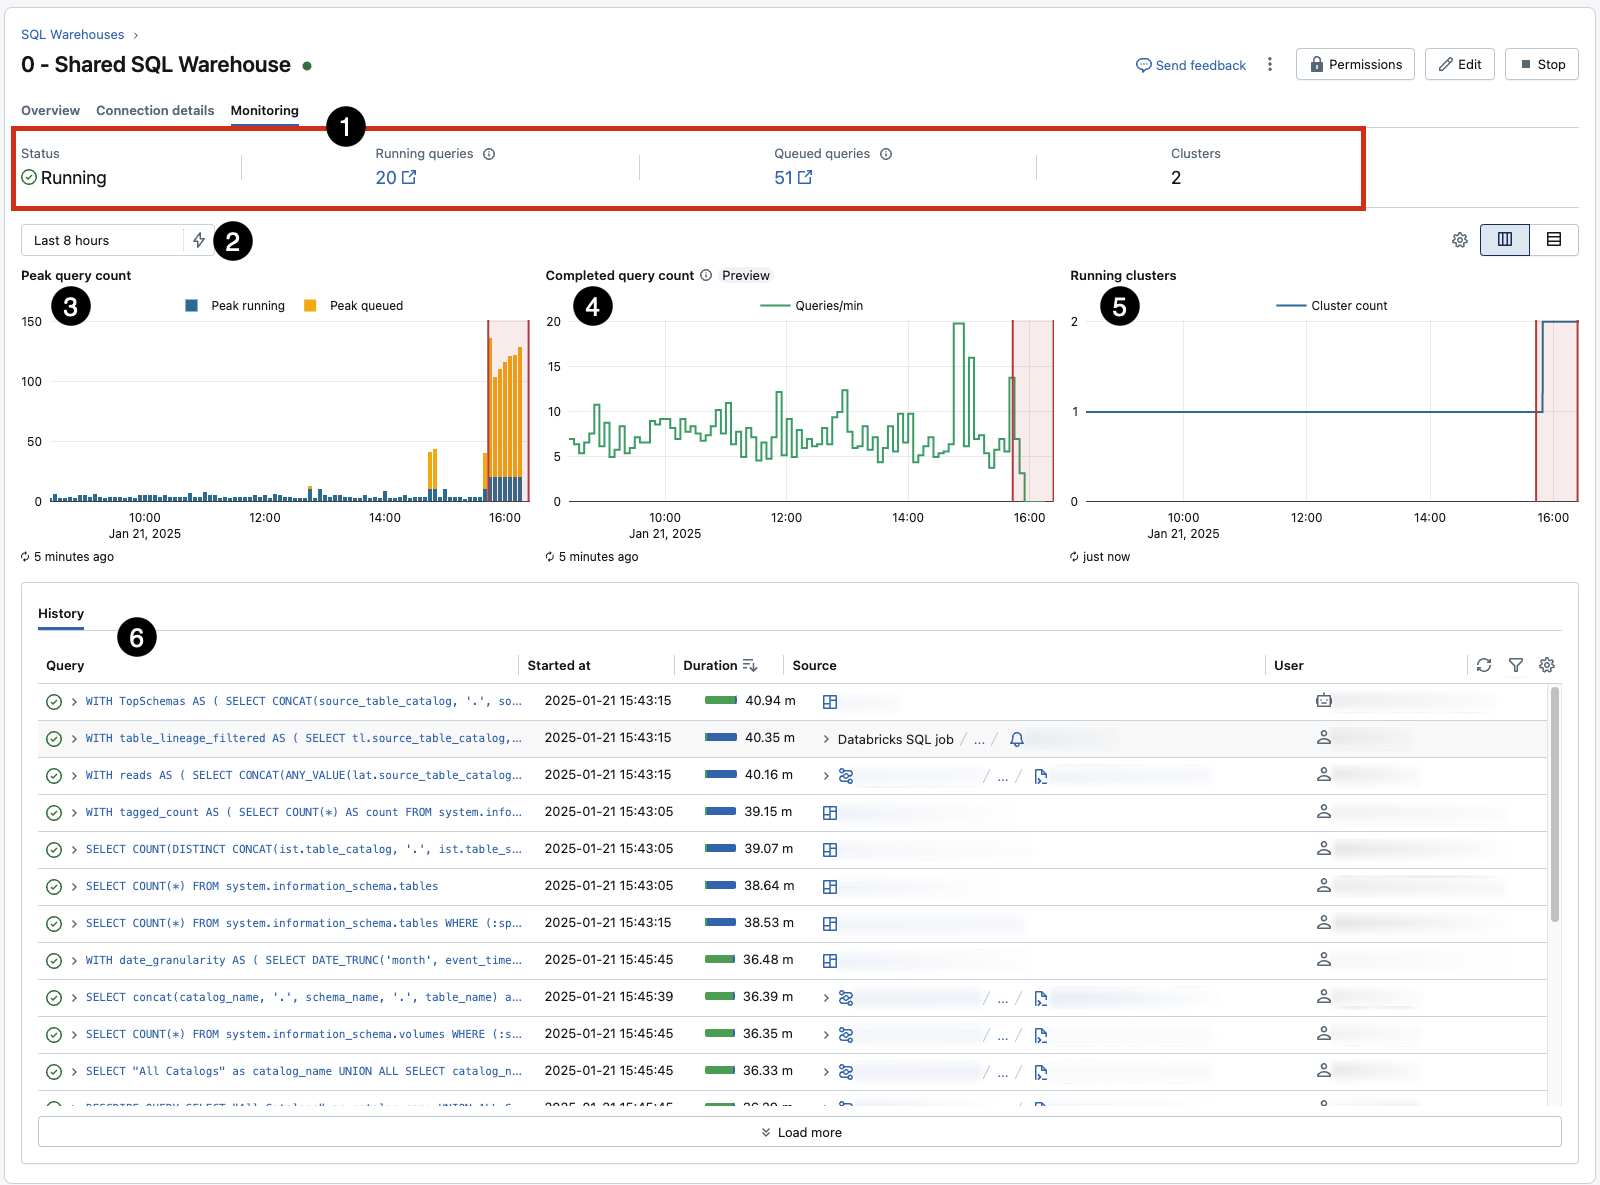
To monitor a SQL warehouse, click the name of a SQL warehouse and then the Monitoring tab. On the Monitoring tab, you see the following monitoring elements:

- Live statistics: Live statistics show the currently running and queued queries, the warehouse status, and the current cluster count.
- Time scale filter: The monitoring time scale filter sets the time range for the query count chart, running cluster chart, and the query history. The default time range is 8 hours, but you can use the
 lightning bolt icon to select a period of 24 hours, 7 days, or 14 days. Alternatively, you can set a custom period using the calendar or click and drag on the bar chart to change the time range.
 - Peak query count chart: The peak query count chart shows the maximum number of concurrent queries, either running or queued, on the warehouse during the selected time frame. The data that supplies this chart does not include metadata queries. Each data point in the chart is the peak within a 5-minute window.
- Running clusters chart: The running clusters chart shows the number of clusters allocated to the warehouse during the selected time frame. During a cluster recycle, this count might temporarily exceed configured maximum.
- Query history table: The query history table shows all of the queries active during the selected time frame, their start time and duration, and the user that executed the query. You can filter the queries by user, query duration, query status, and query type.
Note
The cluster count can be greater than one only if scaling is enabled and configured.