Fine-grained access control on single user compute
This article introduces the data filtering functionality that enables fine-grained access control on queries that run on single user compute (all-purpose or jobs compute configured with Single user access mode). See Access modes.
This data filtering is performed behind the scenes using serverless compute.
Why do some queries on single user compute require data filtering?
Unity Catalog enables you to control access to tabular data at the column and row level (also known as fine-grained access control) using the following features:
When users query views that exclude data from referenced tables or query tables that apply filters and masks, they can use any of the following compute resources without limitations:
- SQL warehouses
- Shared compute
However, if you use single user compute to run such queries, then compute and your workspace must meet specific requirements:
The single user compute resource must be on Databricks Runtime 15.4 LTS or above.
The workspace must be enabled for serverless compute for jobs, notebooks, and Delta Live Tables.
To confirm that your workspace region supports serverless compute, see Features with limited regional availability.
If your single user compute resource and workspace meet these requirements, then data filtering is run automatically whenever you query a view or table that uses fine-grained access control.
Support for materialized views, streaming tables, and standard views
In addition to dynamic views, row filters, and column masks, data filtering also enables queries on the following views and tables that are not supported on single user compute that is running Databricks Runtime 15.3 and below:
-
On single user compute running Databricks Runtime 15.3 and below, the user who runs the query on the view must have
SELECTon the tables and views referenced by the view, which means that you can’t use views to provide fine-grained access control. On Databricks Runtime 15.4 with data filtering, the user who queries the view does not need access to the referenced tables and views.
How does data filtering work on single user compute?
Whenever a query accesses the following database objects, the single user compute resource passes the query along to serverless compute to perform data filtering:
- Views built over tables that the user does not have the
SELECTprivilege on - Dynamic views
- Tables with row filters or column masks defined
- Materialized views and streaming tables
In the following diagram, a user has SELECT on table_1, view_2, and table_w_rls, which has row filters applied. The user does not have SELECT on table_2, which is referenced by view_2.

The query on table_1 is handled entirely by the single user compute resource, because no filtering is required. The queries on view_2 and table_w_rls require data filtering to return the data that the user has access to. These queries are handled by the data filtering capability on serverless compute.
What costs are incurred?
Customers are charged for the serverless compute resources that are used to perform data filtering operations. For pricing information, see Platform Tiers and Add-Ons.
You can query the system billing usage table to see how much you’ve been charged. For example, the following query breaks down compute costs by user:
SELECT usage_date,
sku_name,
 identity_metadata.run_as,
SUM(usage_quantity) AS `DBUs consumed by FGAC`
FROM system.billing.usage
WHERE usage_date BETWEEN '2024-08-01' AND '2024-09-01'
 AND billing_origin_product = 'FINE_GRAINED_ACCESS_CONTROL'
GROUP BY 1, 2, 3 ORDER BY 1;
View query performance when data filtering is engaged
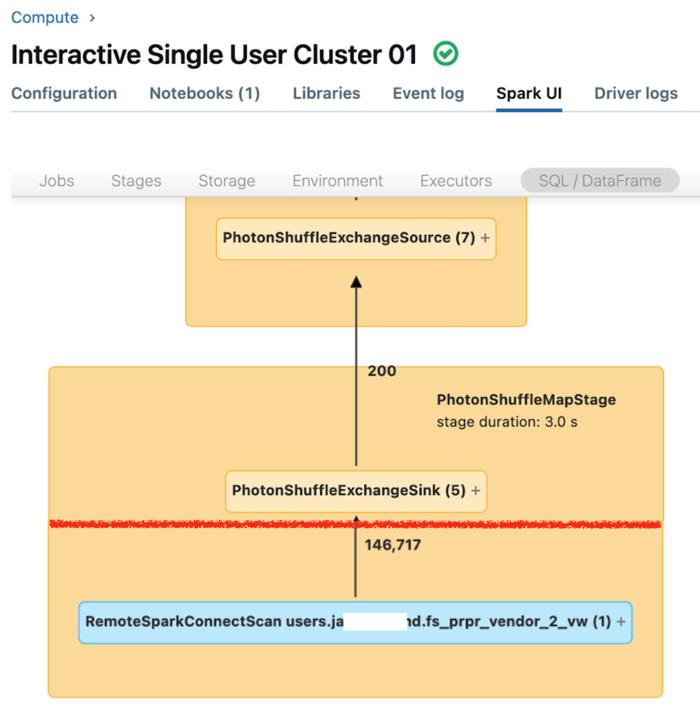
The Spark UI for single user compute displays metrics that you can use to understand the performance of your queries. For each query that you run on the compute resource, the SQL/Dataframe tab displays the query graph representation. If a query was involved in data filtering, the UI displays a RemoteSparkConnectScan operator node at the bottom of the graph. That node displays metrics that you can use to investigate query performance. See View compute information in the Apache Spark UI.

Expand the RemoteSparkConnectScan operator node to see metrics that address such questions as the following:
- How much time did data filtering take? View “total remote execution time.”
- How many rows remained after data filtering? View “rows output.”
- How much data (in bytes) was returned after data filtering? View “rows output size.”
- How many data files were partition-pruned and did not have to be read from storage? View “Files pruned” and “Size of files pruned.”
- How many data files could not be pruned and had to be read from storage? View “Files read” and “Size of files read.”
- Of the files that had to be read, how many were already in the cache? View “Cache hits size” and “Cache misses size.”
Limitations
No support for write or refresh table operations on tables that have row filters or column masks applied.
Specifically, DML operations, such as
INSERT,DELETE,UPDATE,REFRESH TABLE, andMERGE, are not supported. You can only read (SELECT) from these tables.Self-joins are blocked by default when data filtering is called, but you can allow them by setting
spark.databricks.remoteFiltering.blockSelfJoinsto false on compute you are running these commands on.Before you enable self-joins on a single user compute resource, be aware that a self-join query handled by the data filtering capability could return different snapshots of the same remote table.