Use Power BI and serverless Synapse SQL pool to analyze Azure Cosmos DB data with Synapse Link
APPLIES TO:
NoSQL
MongoDB
Gremlin
In this article, you learn how to build a serverless SQL pool database and views over Synapse Link for Azure Cosmos DB. You will query the Azure Cosmos DB containers and then build a model with Power BI over those views to reflect that query.
Important
Mirroring Azure Cosmos DB in Microsoft Fabric is now available in preview for NoSql API. This feature provides all the capabilities of Azure Synapse Link with better analytical performance, ability to unify your data estate with Fabric OneLake and open access to your data in Delta Parquet format. If you are considering Azure Synapse Link, we recommend that you try mirroring to assess overall fit for your organization. Get started wtih mirroring in Microsoft Fabric.
With Azure Synapse Link, you can build near real-time dashboards in Power BI to analyze your Azure Cosmos DB data. There is no performance or cost impact to your transactional workloads, and no complexity of managing ETL pipelines. You can use either DirectQuery or import modes.
Note
You can build Power BI dashboards with just a few clicks using Azure Cosmos DB portal. For more information, see Integrated Power BI experience in Azure Cosmos DB portal for Synapse Link enabled accounts. This will automatically create T-SQL views in Synapse serverless SQL pools on your Azure Cosmos DB containers. You can simply download the .pbids file that connects to these T-SQL views to start building your BI dashboards.
In this scenario, you will use dummy data about Surface product sales in a partner retail store. You will analyze the revenue per store based on the proximity to large households and the impact of advertising for a specific week. In this article, you create two views named RetailSales and StoreDemographics and a query between them. You can get the sample product data from this GitHub repo.
Prerequisites
Make sure to create the following resources before you start:
Create an Azure Cosmos DB account for API for NoSQL or MongoDB.
Enable Azure Synapse Link for your Azure Cosmos DB account
Create a database within the Azure Cosmos DB account and two containers that have analytical store enabled.
Load products data into the Azure Cosmos DB containers as described in this batch data ingestion notebook.
Create a Synapse workspace named SynapseLinkBI.
Connect the Azure Cosmos DB database to the Synapse workspace.
Create a database and views
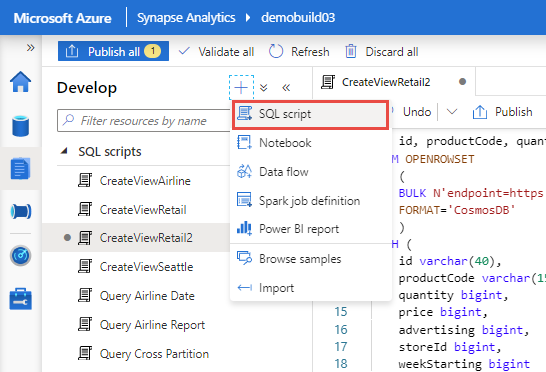
From the Synapse workspace go the Develop tab, select the + icon, and select SQL Script.

Every workspace comes with a serverless SQL endpoint. After creating a SQL script, from the tool bar on the top connect to Built-in.

Creating views in the master or default databases is not recommended or supported. Create a new database, named RetailCosmosDB, and a SQL view over the Synapse Link enabled containers. The following command shows how to create a database:
-- Create database
Create database RetailCosmosDB
Next, create multiple views across different Synapse Link enabled Azure Cosmos DB containers. Views will allow you to use T-SQL to join and query Azure Cosmos DB data sitting in different containers. Make sure to select the RetailCosmosDB database when creating the views.
The following scripts show how to create views on each container. For simplicity, let’s use the automatic schema inference feature of serverless SQL pool over Synapse Link enabled containers:
RetailSales view:
-- Create view for RetailSales container
CREATE VIEW  RetailSales
AS
SELECT  *
FROM OPENROWSET (
    'CosmosDB', N'account=<Your Azure Cosmos DB account name>;database=<Your Azure Cosmos DB database name>;region=<Your Azure Cosmos DB Region>;key=<Your Azure Cosmos DB key here>',RetailSales)
AS q1
Make sure to insert your Azure Cosmos DB region and the primary key in the previous SQL script. All the characters in the region name should be in lower case without spaces. Unlike the other parameters of the OPENROWSET command, the container name parameter should be specified without quotes around it.
StoreDemographics view:
-- Create view for StoreDemographics container
CREATE VIEW StoreDemographics
AS
SELECT  *
FROM OPENROWSET (
    'CosmosDB', N'account=<Your Azure Cosmos DB account name>;database=<Your Azure Cosmos DB database name>;region=<Your Azure Cosmos DB Region>;key=<Your Azure Cosmos DB key here>', StoreDemographics)
AS q1
Now run the SQL script by selecting the Run command.
Query the views
Now that the two views are created, let’s define the query to join those two views as follows:
SELECT
sum(p.[revenue]) as revenue
,p.[advertising]
,p.[storeId]
,p.[weekStarting]
,q.[largeHH]
 FROM [dbo].[RetailSales] as p
INNER JOIN [dbo].[StoreDemographics] as q ON q.[storeId] = p.[storeId]
GROUP BY p.[advertising], p.[storeId], p.[weekStarting], q.[largeHH]
Select Run that gives the following table as result:

Model views over containers with Power BI
Next open the Power BI desktop and connect to the serverless SQL endpoint by using the following steps:
Open the Power BI Desktop application. Select Get data and select more.
Choose Azure Synapse Analytics (SQL DW) from the list of connection options.
Enter the name of the SQL endpoint where the database is located. Enter
SynapseLinkBI-ondemand.sql.azuresynapse.netwithin the Server field. In this example, SynapseLinkBI is name of the workspace. Replace it if you have given a different name to your workspace. Select Direct Query for data connectivity mode and then OK.Select the preferred authentication method such as Microsoft Entra ID.
Select the RetailCosmosDB database and the RetailSales, StoreDemographics views.
Select Load to load the two views into the direct query mode.
Select Model to create a relationship between the two views through the storeId column.
Drag the StoreId column from the RetailSales view towards the StoreId column in the StoreDemographics view.
Select the Many to one (*:1) relationship because there are multiple rows with the same store ID in the RetailSales view. StoreDemographics has only one store ID row (it is a dimension table).
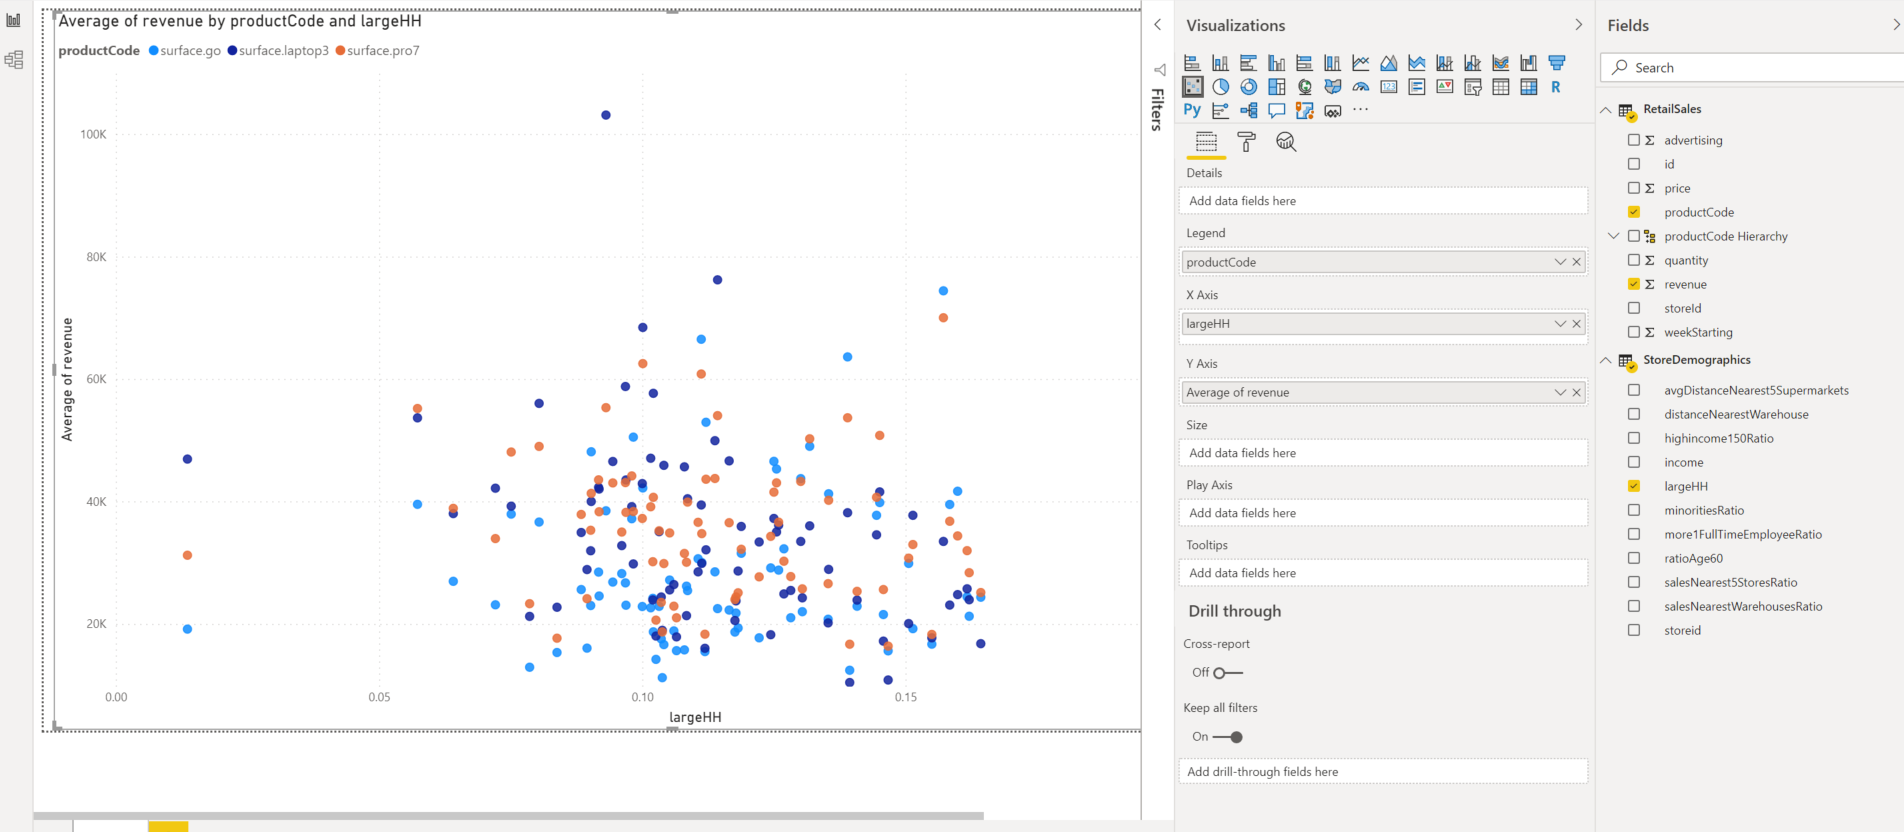
Now navigate to the report window and create a report to compare the relative importance of household size to the average revenue per store based on the scattered representation of revenue and LargeHH index:
Select Scatter chart.
Drag and drop LargeHH from the StoreDemographics view into the X-axis.
Drag and drop Revenue from RetailSales view into the Y-axis. Select Average to get the average sales per product per store and per week.
Drag and drop the productCode from RetailSales view into the legend to select a specific product line. After you choose these options, you should see a graph like the following screenshot:

Next steps
Integrated Power BI experience in Azure Cosmos DB portal for Synapse Link enabled accounts
Use T-SQL to query Azure Cosmos DB data using Azure Synapse Link
Use serverless SQL pool to analyze Azure Open Datasets and visualize the results in Azure Synapse Studio