Container group and instance logging with Azure Monitor logs
Log Analytics workspaces provide a centralized location for storing and querying log data not only from Azure resources, but also on-premises resources and resources in other clouds. Azure Container Instances includes built-in support for sending logs and event data to Azure Monitor logs.
To send container group log and event data to Azure Monitor logs, specify an existing Log Analytics workspace ID and workspace key when configuring a container group.
The following sections describe how to create a logging-enabled container group and how to query logs. You can also update a container group with a workspace ID and workspace key to enable logging.
Note
This article was recently updated to use the term Azure Monitor logs instead of Log Analytics. Log data is still stored in a Log Analytics workspace and is still collected and analyzed by the same Log Analytics service. We are updating the terminology to better reflect the role of logs in Azure Monitor. See Azure Monitor terminology changes for details.
Prerequisites
To enable logging in your container instances, you need the following prerequisites:
Get Log Analytics credentials
Azure Container Instances needs permission to send data to your Log Analytics workspace. To grant this permission and enable logging, you must provide the Log Analytics workspace ID and one of its keys (either primary or secondary) when you create the container group.
To obtain the log analytics workspace ID and primary key:
- Navigate to your Log Analytics workspace in the Azure portal
- Under Settings, select Agents management
- Take note of:
- Workspace ID
- Primary key
Create container group
Now that you have the log analytics workspace ID and primary key, you're ready to create a logging-enabled container group.
The following examples demonstrate two ways to create a container group that consists of a single fluentd container: Azure CLI, and Azure CLI with a YAML template. The fluentd container produces several lines of output in its default configuration. Because this output is sent to your Log Analytics workspace, it works well for demonstrating the viewing and querying of logs.
Deploy with Azure CLI
To deploy with the Azure CLI, specify the --log-analytics-workspace and --log-analytics-workspace-key parameters in the az container create command. Replace the two workspace values with the values you obtained in the previous step (and update the resource group name) before running the following command.
Note
The following example pulls a public container image from Docker Hub. We recommend that you set up a pull secret to authenticate using a Docker Hub account instead of making an anonymous pull request. To improve reliability when working with public content, import and manage the image in a private Azure container registry. Learn more about working with public images.
az container create \
    --resource-group myResourceGroup \
    --name mycontainergroup001 \
    --image fluent/fluentd:v1.3-debian-1 \
    --log-analytics-workspace <WORKSPACE_ID> \
    --log-analytics-workspace-key <WORKSPACE_KEY>
Deploy with YAML
Use this method if you prefer to deploy container groups with YAML. The following YAML defines a container group with a single container. Copy the YAML into a new file, then replace LOG_ANALYTICS_WORKSPACE_ID and LOG_ANALYTICS_WORKSPACE_KEY with the values you obtained in the previous step. Save the file as deploy-aci.yaml.
Note
The following example pulls a public container image from Docker Hub. We recommend that you set up a pull secret to authenticate using a Docker Hub account instead of making an anonymous pull request. To improve reliability when working with public content, import and manage the image in a private Azure container registry. Learn more about working with public images.
apiVersion: 2019-12-01
location: eastus
name: mycontainergroup001
properties:
  containers:
  - name: mycontainer001
    properties:
      environmentVariables: []
      image: fluent/fluentd:v1.3-debian-1
      ports: []
      resources:
        requests:
          cpu: 1.0
          memoryInGB: 1.5
  osType: Linux
  restartPolicy: Always
  diagnostics:
    logAnalytics:
      workspaceId: LOG_ANALYTICS_WORKSPACE_ID
      workspaceKey: LOG_ANALYTICS_WORKSPACE_KEY
tags: null
type: Microsoft.ContainerInstance/containerGroups
Next, execute the following command to deploy the container group. Replace myResourceGroup with a resource group in your subscription (or first create a resource group named "myResourceGroup"):
az container create --resource-group myResourceGroup --name mycontainergroup001 --file deploy-aci.yaml
You should receive a response from Azure containing deployment details shortly after issuing the command.
View logs
After you deploy the container group, it can take several minutes (up to 10) for the first log entries to appear in the Azure portal.
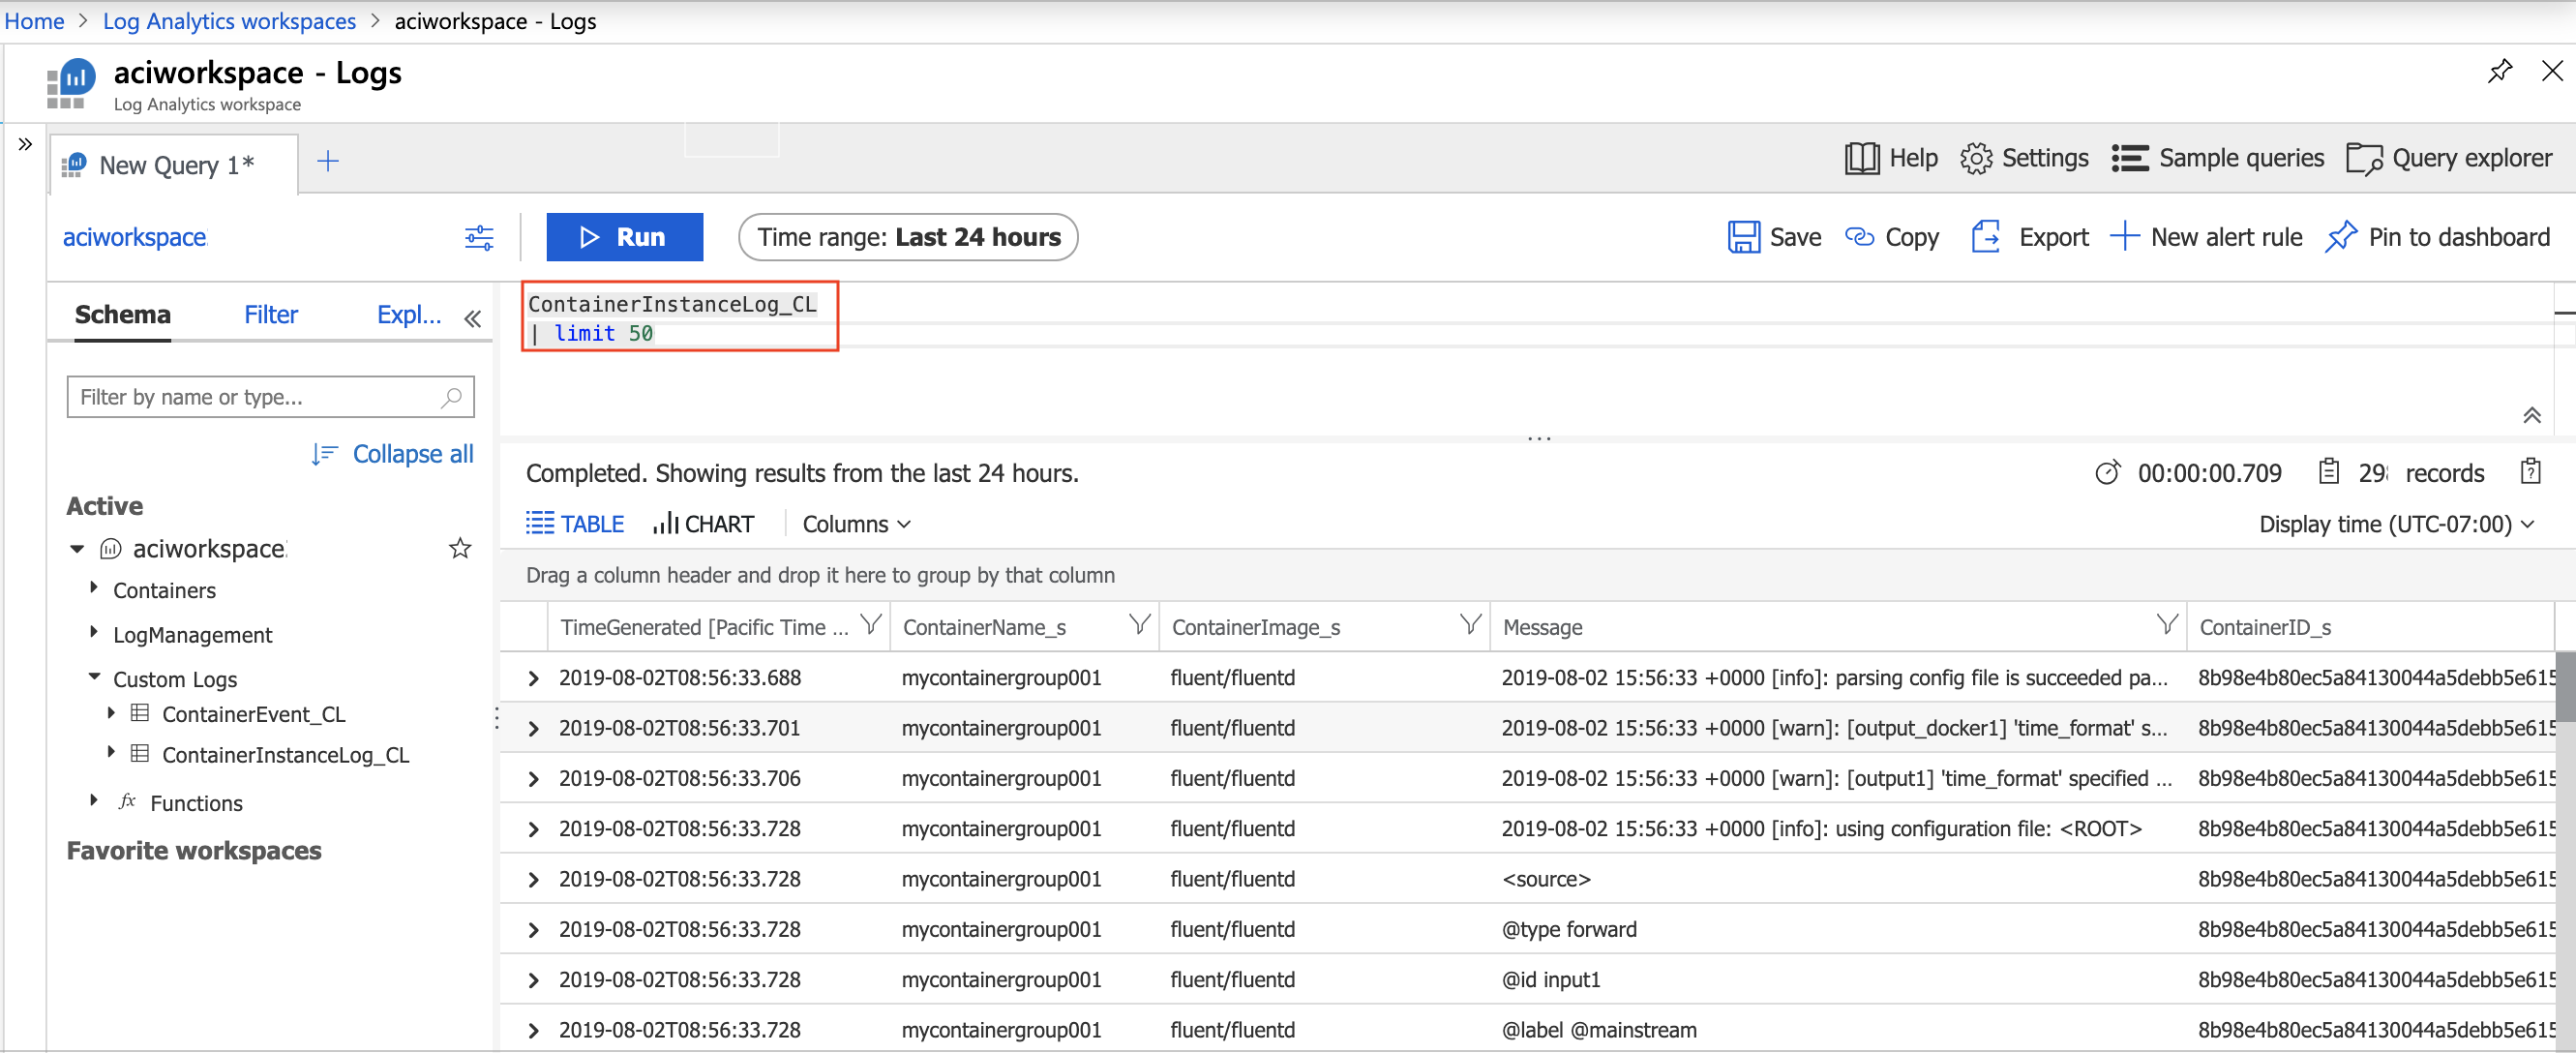
To view the container group's logs in the ContainerInstanceLog_CL table:
- Navigate to your Log Analytics workspace in the Azure portal
- Under General, select Logs
- Type the following query:
ContainerInstanceLog_CL | limit 50 - Select Run
You should see several results displayed by the query. If at first you don't see any results, wait a few minutes, then select the Run button to execute the query again. By default, log entries are displayed in Table format. You can then expand a row to see the contents of an individual log entry.

View events
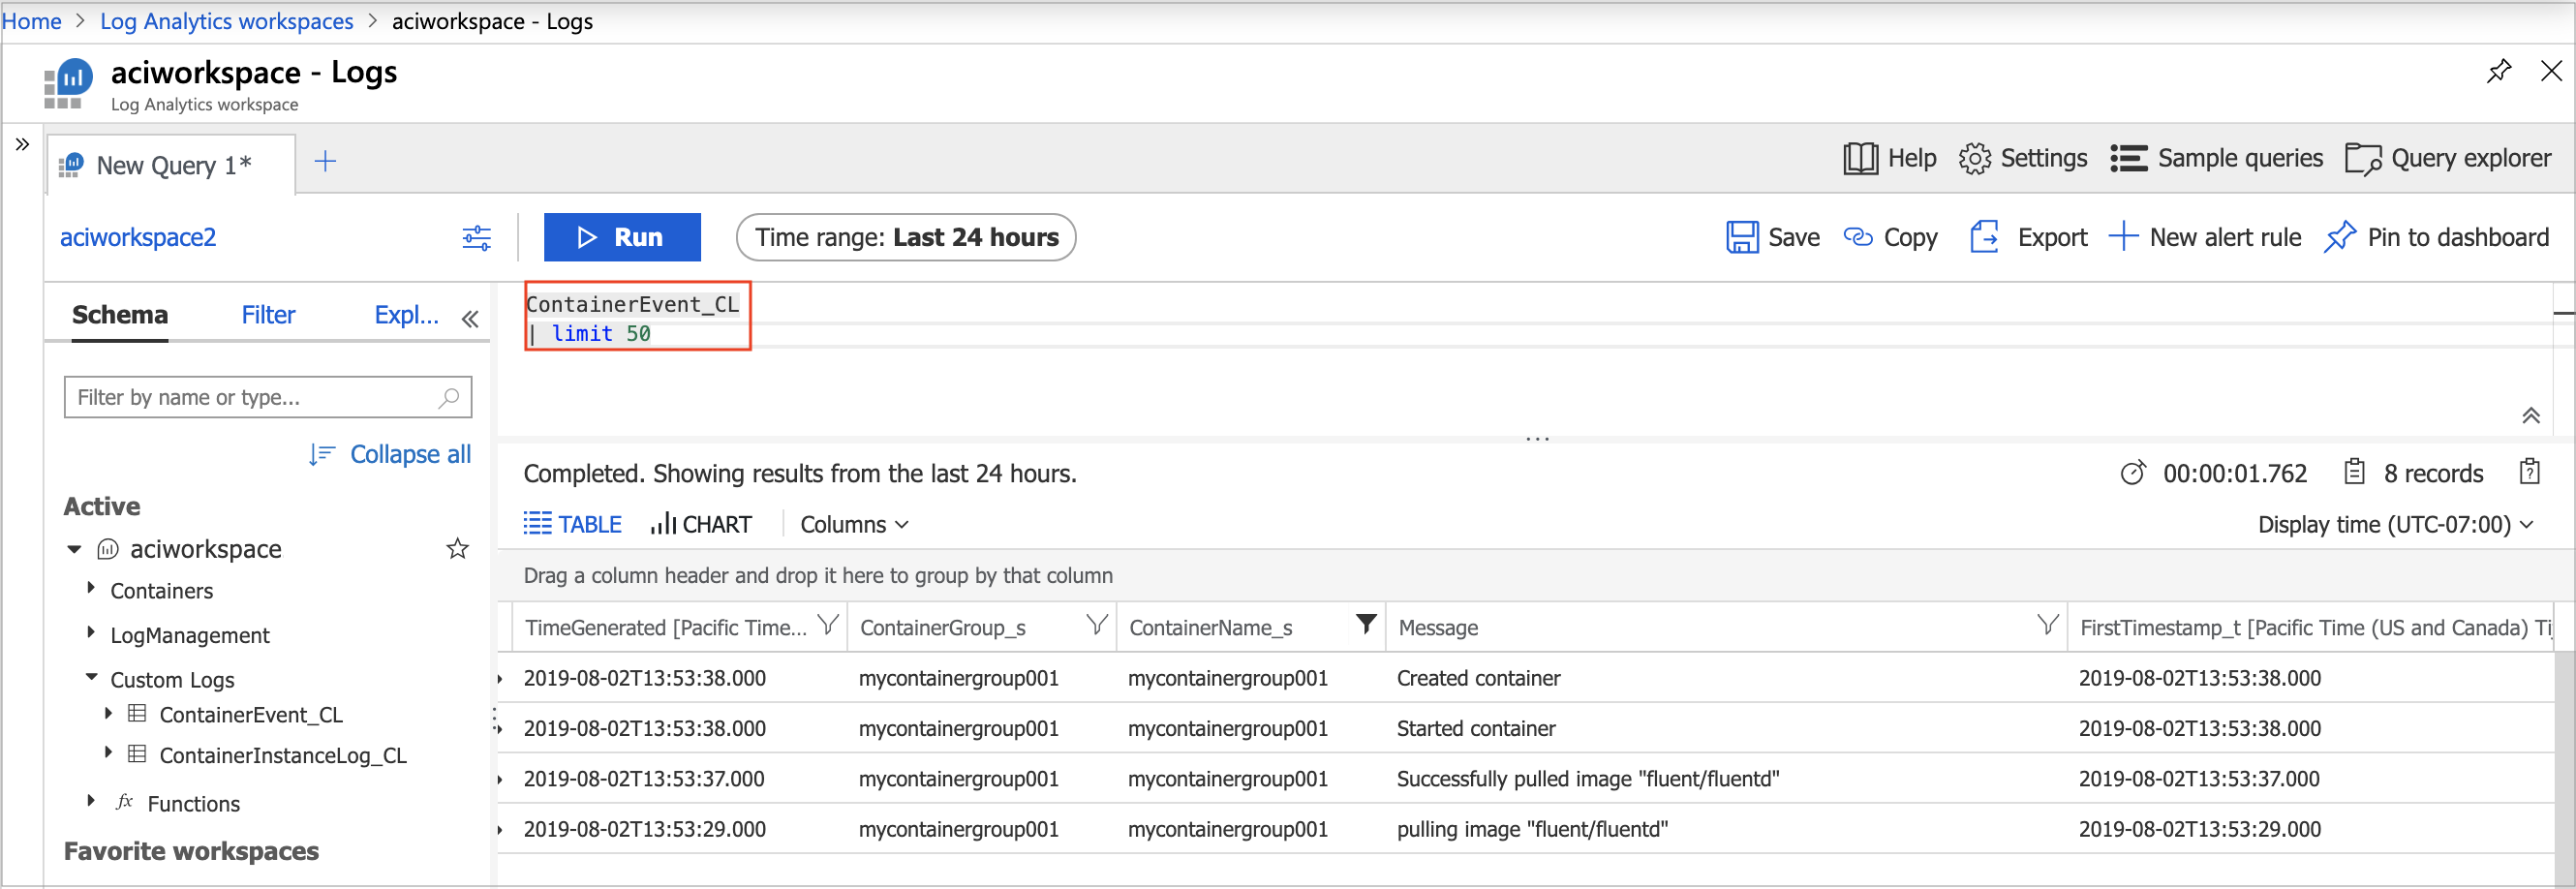
You can also view events for container instances in the Azure portal. Events include the time the instance is created and when it starts. To view the event data in the ContainerEvent_CL table:
- Navigate to your Log Analytics workspace in the Azure portal
- Under General, select Logs
- Type the following query:
ContainerEvent_CL | limit 50 - Select Run
You should see several results displayed by the query. If at first you don't see any results, wait a few minutes, then select the Run button to execute the query again. By default, entries are displayed in Table format. You can then expand a row to see the contents of an individual entry.

Query container logs
Azure Monitor logs includes an extensive query language for pulling information from potentially thousands of lines of log output.
The basic structure of a query is the source table (in this article, ContainerInstanceLog_CL or ContainerEvent_CL) followed by a series of operators separated by the pipe character (|). You can chain several operators to refine the results and perform advanced functions.
To see example query results, paste the following query into the query text box, and select the Run button to execute the query. This query displays all log entries whose "Message" field contains the word "warn":
ContainerInstanceLog_CL
| where Message contains "warn"
More complex queries are also supported. For example, this query displays only those log entries for the "mycontainergroup001" container group generated within the last hour:
ContainerInstanceLog_CL
| where (ContainerGroup_s == "mycontainergroup001")
| where (TimeGenerated > ago(1h))
Log schema
To learn about the Azure Monitor legacy schema for Log Analytics, see Legacy Log Analytics tables.
Using Diagnostic Settings
The newer tables require use of diagnostic settings to route information to Log Analytics. The diagnostic settings feature for Container Instances is in public preview, and it can be enabled through preview features options in the Azure portal.
To learn more, see Azure Monitor Log Analytics tables.
Next steps
Azure Monitor logs
For more information about querying logs and configuring alerts in Azure Monitor logs, see:
Monitor container CPU and memory
For information about monitoring container instance CPU and memory resources, see: