Use the live trace tool for Azure SignalR Service
The live trace tool is a single web application for capturing and displaying live traces in Azure SignalR Service. The live traces can be collected in real time without any dependency on other services.
You can enable and disable the live trace feature with a single selection. You can also choose any log category that you're interested in.
Note
Live traces are counted as outbound messages.
Using Microsoft Entra ID to access the live trace tool is not supported.
Open the live trace tool
When you enable an access key, you use an access token to authenticate the live trace tool. Otherwise, you use Microsoft Entra ID to authenticate the tool.
You can check whether you enabled an access key by going to the Keys page for Azure SignalR Service in the Azure portal.
Steps if you enabled an access key
- Go to the Azure portal and your Azure SignalR Service page.
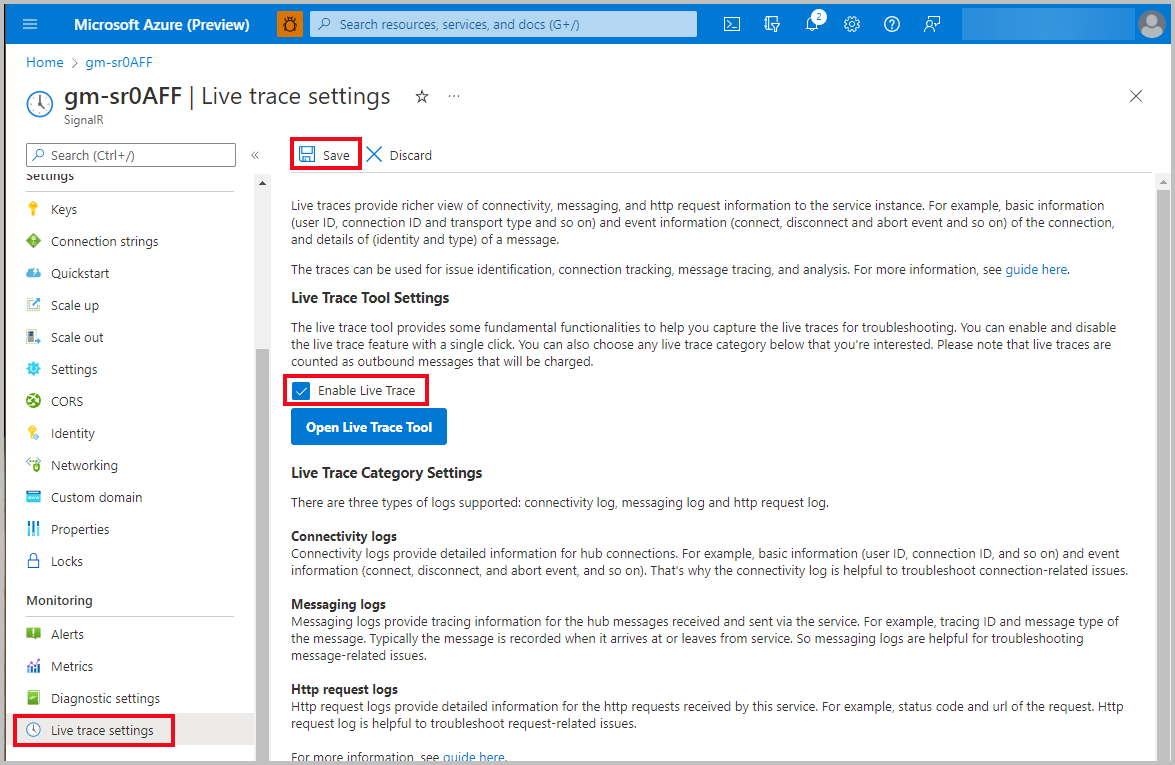
- On the left menu, under Monitoring, select Live trace settings.
- Select Enable Live Trace.
- Select the Save button, and then wait for the changes to take effect.
- Select Open Live Trace Tool.

Steps if you didn't enable an access key
Assign live trace tool API permission to yourself
- Go to the Azure portal and your Azure SignalR Service page.
- Select Access control (IAM).
- On the new page, select +Add, and then select Role assignment.
- On the new page, select the Job function roles tab, select the SignalR Service Owner role, and then select Next.
- On the Members page, click +Select members.
- On the new panel, search for and select members, and then click Select.
- Select Review + assign, and wait for the completion notification.
Open the tool
- Go to the Azure portal and your Azure SignalR Service page.
- On the left menu, under Monitoring, select Live trace settings.
- Select Enable Live Trace.
- Select the Save button, and then wait for the changes to take effect.
- Select Open Live Trace Tool.

Sign in with your Microsoft account
- When the Microsoft sign-in window opens in the live trace tool, enter your credentials. If no sign-in window appears, be sure to allow pop-up windows in your browser.
- Wait for Ready to appear on the status bar.
Capture live traces
In the live trace tool, you can:
- Begin to capture real-time live traces from the Azure SignalR Service instance.
- Clear the captured real-time live traces.
- Export live traces to a file. The currently supported file format is CSV.
- Filter the captured real-time live traces with one specific keyword. Separators (for example, space, comma, or semicolon), if present, are treated as part of the keyword.

The real-time live traces that the tool captures contain detailed information for troubleshooting.
| Name | Description |
|---|---|
| Time | Log event time. |
| Log Level | Log event level: Trace, Debug, Informational, Warning, or Error. |
| Event Name | Operation name of the log event. |
| Message | Detailed message of the log event. |
| Exception | Runtime exception of the Azure Web PubSub service. |
| Hub | User-defined hub name. |
| Connection ID | Identity of the connection. |
| Connection Type | Type of the connection. Allowed values are Server (connections between server and service) and Client (connections between client and service). |
| User ID | Identity of the user. |
| IP | IP address of the client. |
| Server Sticky | Routing mode of the client. Allowed values are Disabled, Preferred, and Required. For more information, see ServerStickyMode. |
| Transport | Transport that the client can use to send HTTP requests. Allowed values are WebSockets, ServerSentEvents, and LongPolling. For more information, see HttpTransportType. |
| Message Tracing ID | Unique identifier for a message. |
| Route Template | Route template of the API. |
| Http Method | HTTP method: POST, GET, PUT, or DELETE. |
| URL | Uniform resource locator. |
| Trace ID | Unique identifier to represent a request. |
| Status Code | HTTP response code. |
| Duration | Duration between receiving and processing the request. |
| Headers | Additional information that the client and the server pass with an HTTP request or response. |
| Invocation ID | Unique identifier to represent an invocation (available only for ASP.NET SignalR). |
| Message Type | Type of the message. Examples include BroadcastDataMessage, JoinGroupMessage, and LeaveGroupMessage. |
Next steps
Learn how to handle common problems with the live trace tool:
- To troubleshoot typical problems based on live traces, see the troubleshooting guide.
- For self-diagnosis to find the root cause directly or narrow down the problem, see the introduction to troubleshooting methods.