Enable recommended alert rules for Azure Local
Applies to: Azure Local, version 23H2
This article describes how to enable recommended alert rules for Azure Local.
A metric alert rule monitors a resource by evaluating conditions on the resource metrics at regular intervals. If the conditions are met, an alert is fired. Recommended alerts are predefined metric-based alerts for your Azure Local system resource. These alerts provide you with initial monitoring for a common set of metrics including CPU percentage and available memory.
For information about how to set up log alerts and metric alerts, see Set up log alerts for Azure Local and Set up metric alerts for Azure Local.
Prerequisites
Before you begin, make sure that the following prerequisites are completed:
You have access to an Azure Local system that is deployed and registered.
The
AzureEdgeTelemetryAndDiagnosticsextension must be installed to collect telemetry and diagnostics information from Azure Local. For more information about the extension, see Azure Local telemetry and diagnostics extension overview.
When to enable recommended alerts
If you don't have alert rules defined for your cluster resource, you can enable recommended out-of-the-box alert rules in the Azure portal. The system compiles a list of recommended alert rules using Metrics data and provides threshold recommendations based on:
- The resource provider’s knowledge of important signals and thresholds for monitoring the resource.
- Data that tells us what customers commonly alert on for this resource.
For a list of predefined recommended alerts available for Azure Local, see Recommended alert rules for Azure Local.
Enable recommended alert rules
Follow these steps to enable recommended alert rules in the Azure portal:
Go to your Azure Local system resource page and select your system.
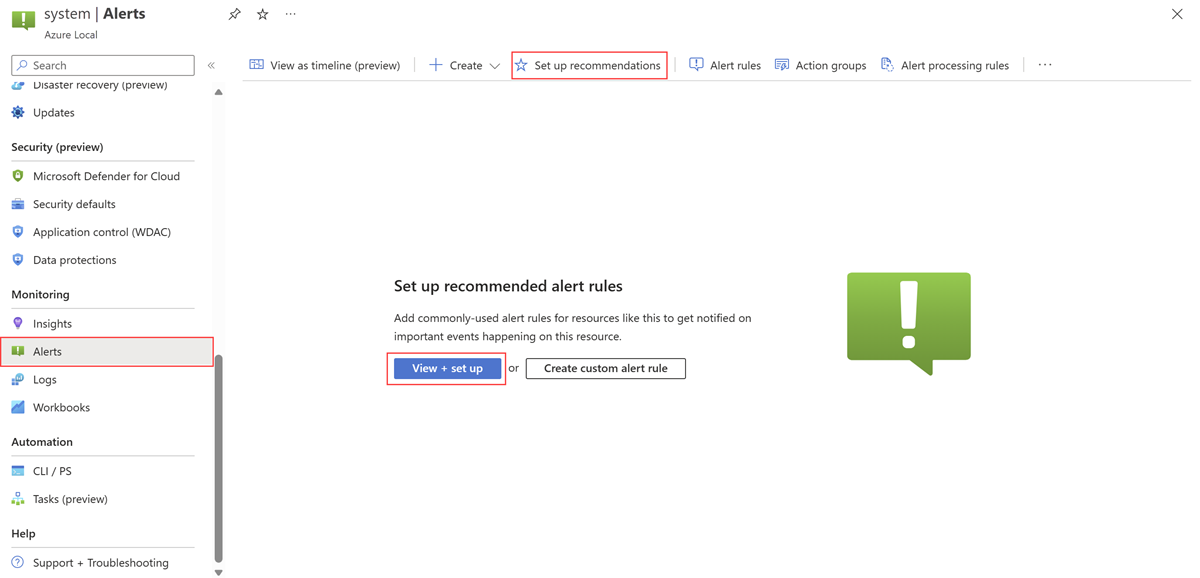
On the left pane, select Alerts from the Monitoring section, and then select View + set up to enable the recommended alerts. You can also select Set up recommendations.
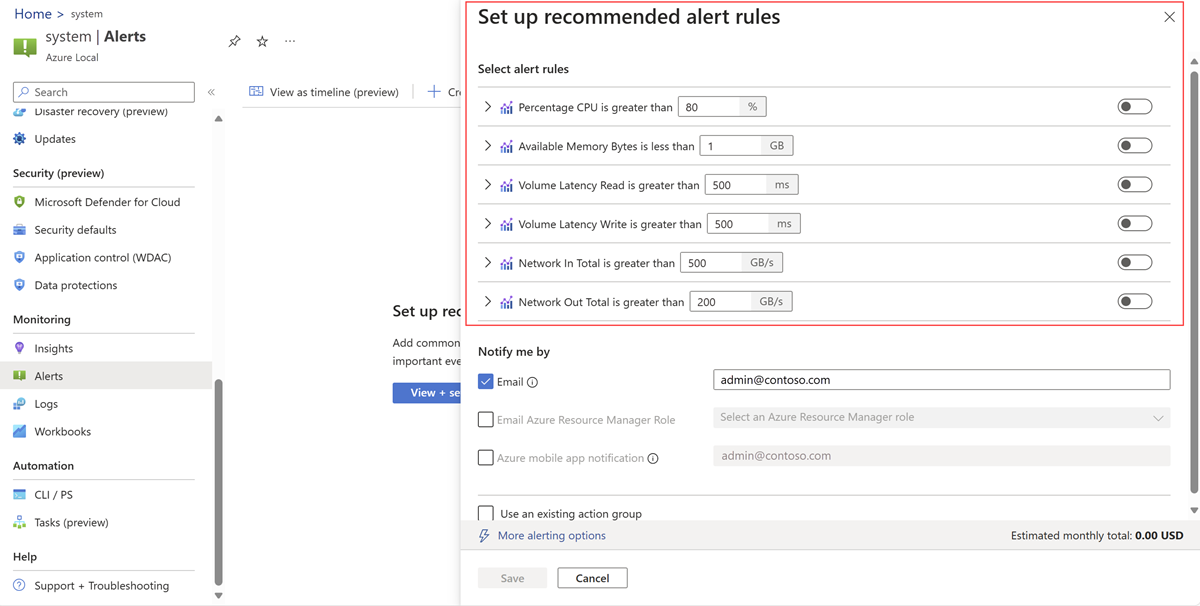
In the Set up recommended alert rules pane, review the list of recommended alert rules for your cluster. In the Select alert rules section, all recommended alerts are populated with the default values for the rule condition, such as the percentage of CPU usage that you want to trigger an alert.
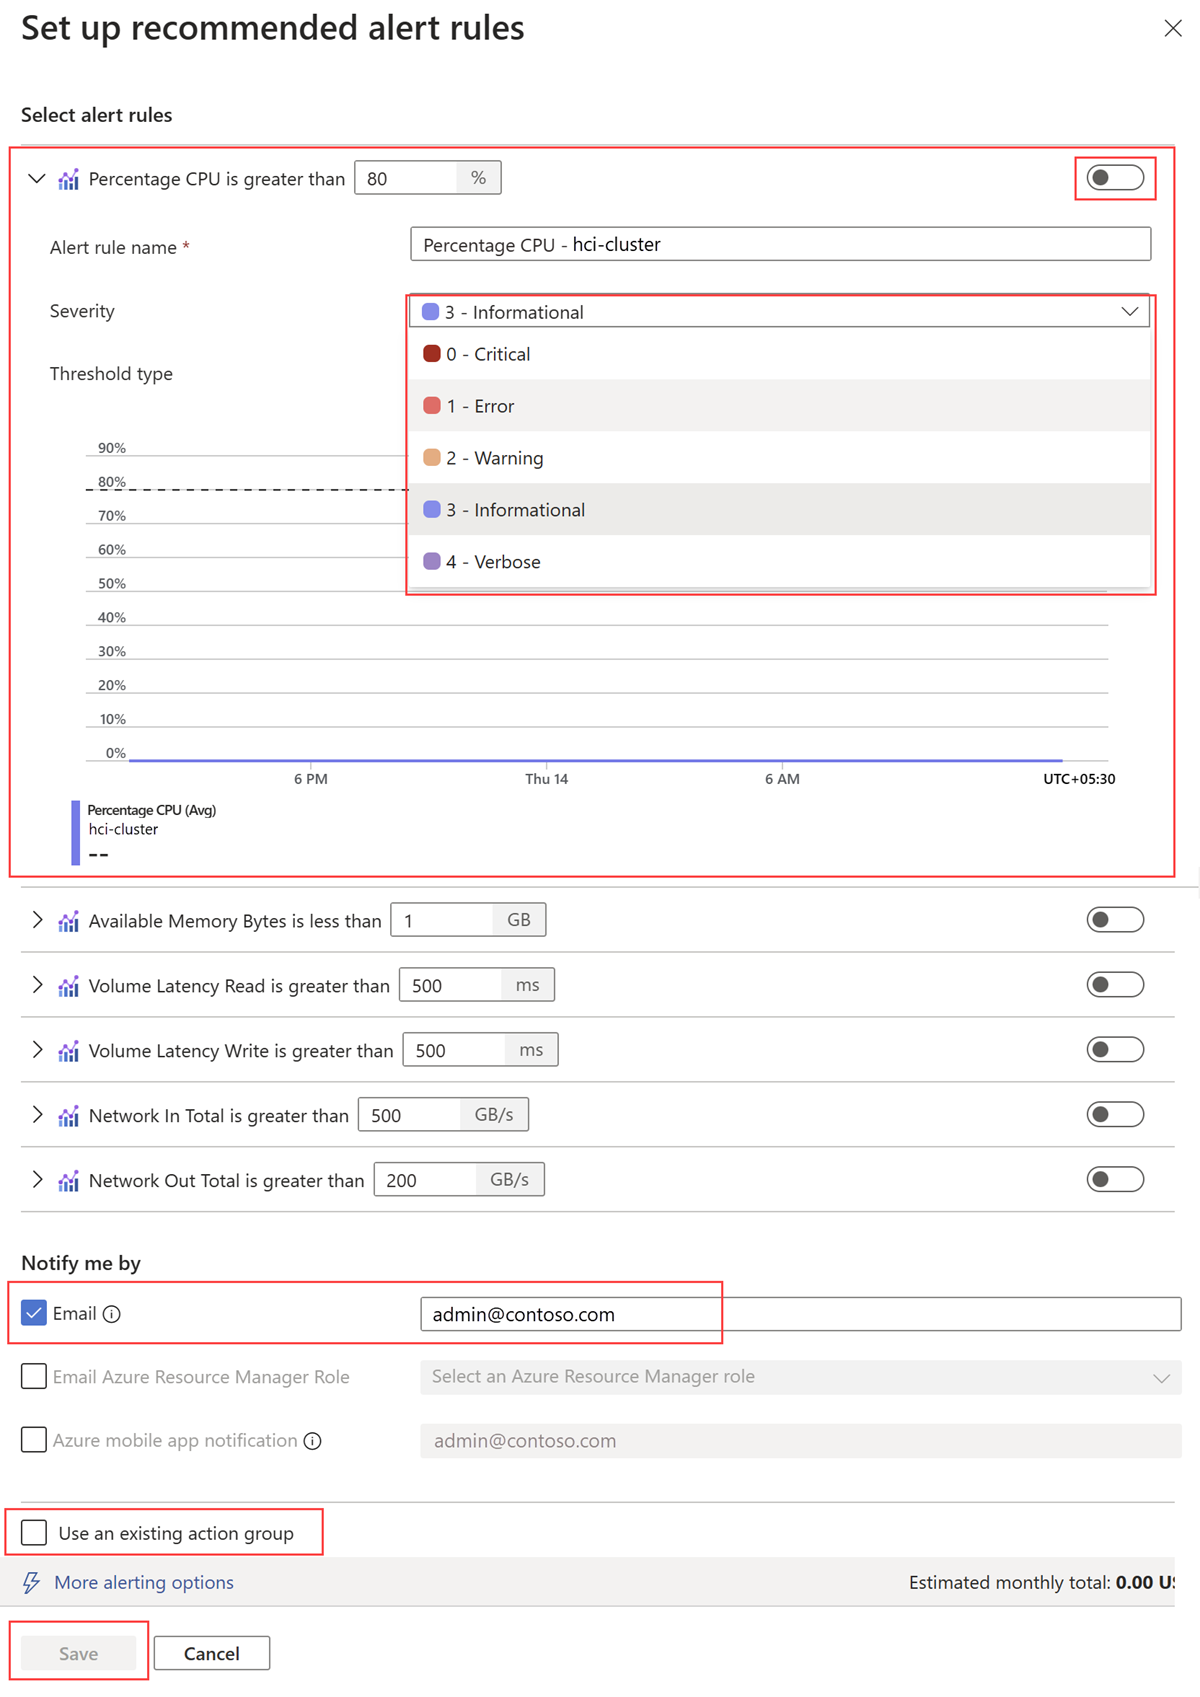
Expand each of the alert rules to see its details. By default, the severity for each is Informational. You can change it to another severity, such as Error. You can also change the recommended threshold if required.
In the Notify me by section, ensure that Email is enabled and provide an email address to be notified when any of the alerts fire.
Select Use an existing action group, and enter the details of the existing action group if you want to use an action group that already exists.
Turn on the toggle to create the alert rules, and select Save.
View recommended alert rules
When the alert rule creation is complete, you'll see the alerts page for the Azure Local system.
Follow these steps to view recommended alert rules:
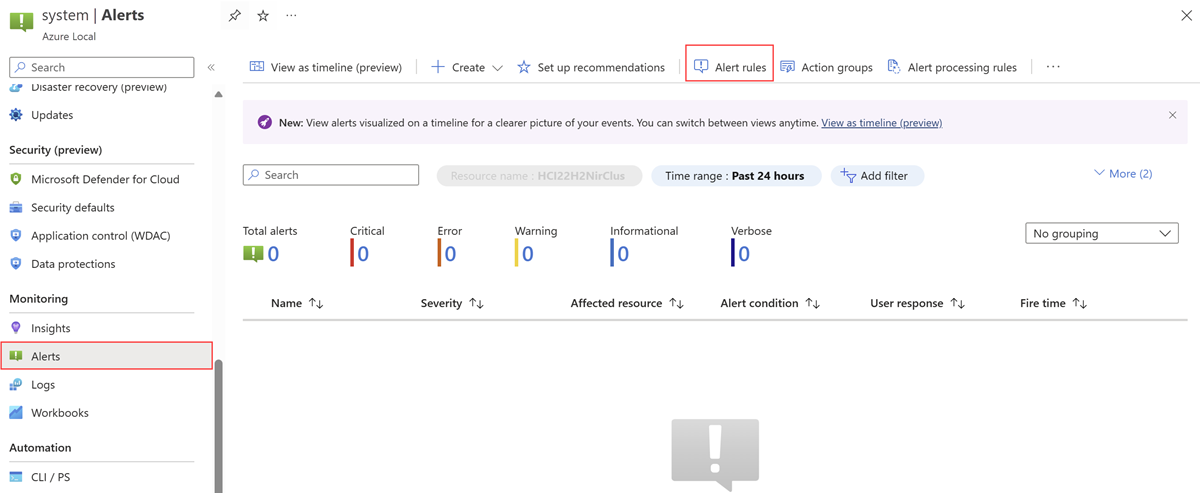
Go to your Azure Local system resource page and select your system. From the Monitoring section on the left menu, select Alerts.
On the Alerts page, select Alert rules to view the rules you created.
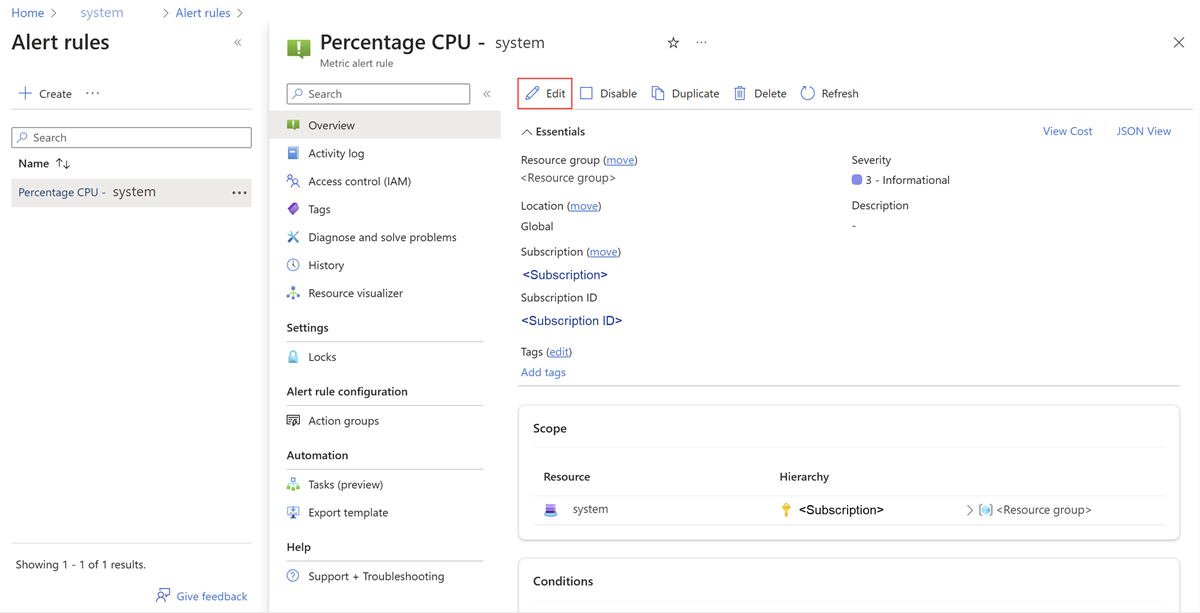
On the Alert rules page, select the alert rule that you want to view or edit.
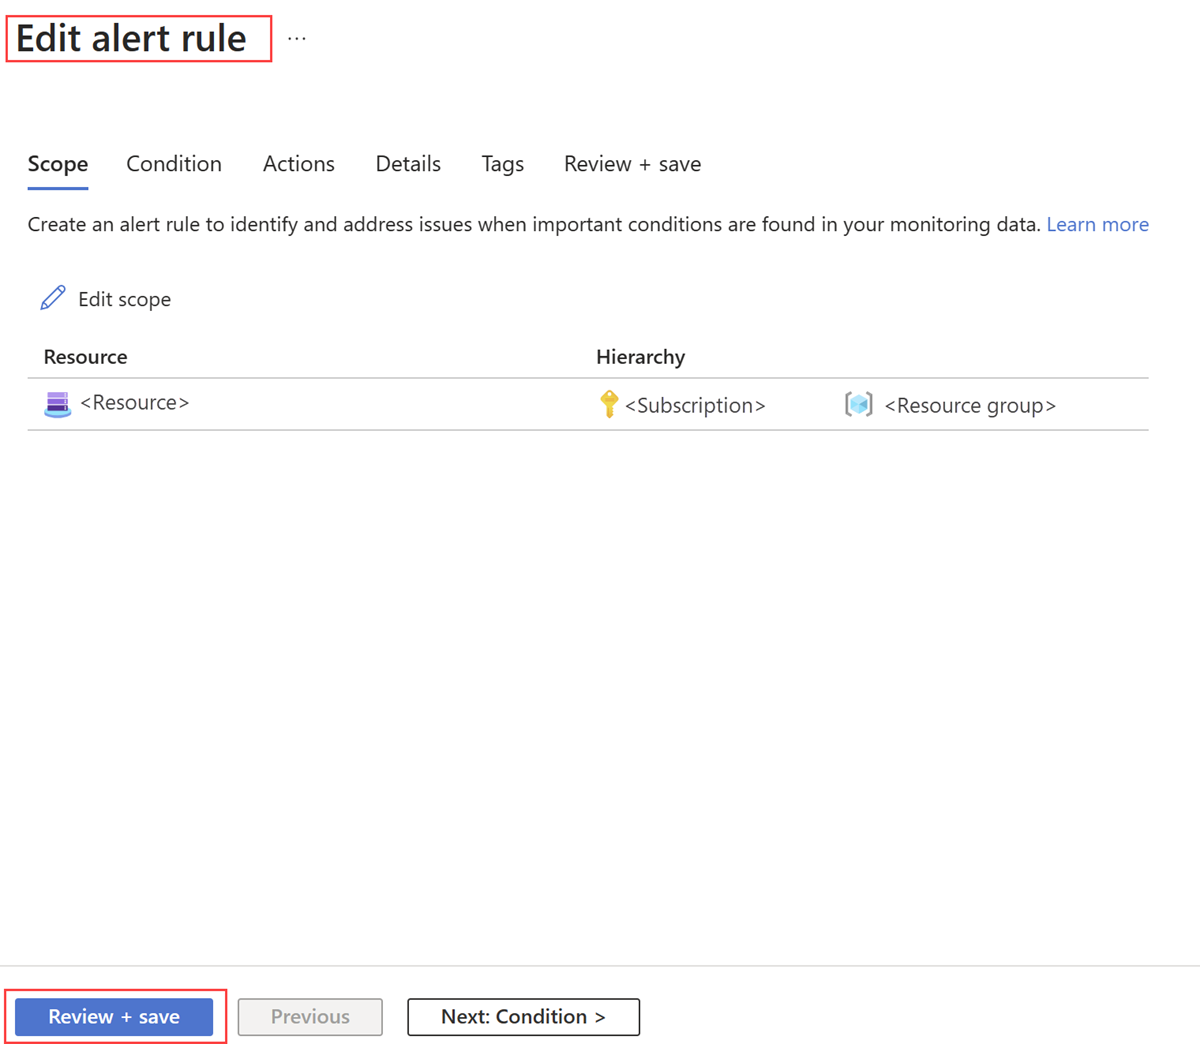
Review the details of the selected alert rule. You can also select Edit to modify the default values of the selected alert rule, such as the default threshold value.
After making the necessary changes, select Review + save.
Recommended alert rules for Azure Local
Here's a list of predefined recommended alert rules available for Azure Local:
| Alert name | Performance counters used | Unit | Suggested threshold value |
|---|---|---|---|
| Percentage CPU | Hyper-V Hypervisor Logical Processor\\% Total Run Time | Percentage | Greater than 80 |
| Available Memory Bytes | Memory\\Available Bytes | GB | Less than 1 |
| Volume Latency Read | Cluster CSVFS\\Avg. sec/Read | Milliseconds | Greater than 500 |
| Volume Latency Write | Cluster CSVFS\\Avg. sec/Write | Milliseconds | Greater than 500 |
| Network In Per Second | Network Adapter\\Bytes Received/sec | GigaBytesPerSecond | Greater than 500 |
| Network Out Per Second | Network Adapter\\Bytes Sent/sec | GigaBytesPerSecond | Greater than 200 |
Next steps
- Learn how to Create Azure Monitor alert rules.
- Learn how to monitor Azure Local with Azure Monitor Metrics.
