Monitor multiple Azure Stack HCI clusters with Insights
Applies to: Azure Stack HCI, version 22H2
Important
Azure Stack HCI is now part of Azure Local. Product documentation renaming is in progress. However, older versions of Azure Stack HCI, for example 22H2 will continue to reference Azure Stack HCI and won't reflect the name change. Learn more.
This article explains how to use Insights to monitor multiple Azure Stack HCI clusters. For a single Azure Stack HCI cluster, see Monitor Azure Stack HCI with Insights.
Important
If you registered your Azure Stack HCI cluster and configured Insights before November 2023, certain features that use Azure Monitor Agent (AMA), such as Arc for Servers, VM Insights, Defender for Cloud, or Sentinel might not collect logs and event data correctly. For troubleshooting guidance, see the Troubleshoot clusters registered before November 2023 section.
For information about the benefits, prerequisites, and how to enable Insights on each cluster, see Benefits, Prerequisites, and Enable Insights.
Watch the video for a quick introduction:
View health, performance, and usage insights
Insights stores its data in a Log Analytics workspace, which allows it to deliver powerful aggregation and filtering and analyze data trends over time. There is no direct cost for Insights. Users are billed based on the amount of data ingested and the data retention settings of their Log Analytics workspace.
You can access Insights from Azure Monitor > Insights hub > Azure Stack HCI. You will see the following tabs to toggle between views: Add to monitoring, Cluster health, Servers, Virtual machines, Storage.
Filtering results
The visualization can be filtered across subscriptions. You can filter the results based on the following drop-down menus:
- Time range: This filter allows you to select a range for trend view. The default value is Last 24 hours.
- Subscriptions: Shows the subscriptions that have registered Azure Stack HCI clusters. You can select multiple subscriptions in this filter.
- HCI clusters: Lists the registered Azure Stack HCI clusters that have Logs and Monitoring capabilities enabled in the selected time range. You can select multiple clusters from this filter.
- Resource groups: This filter allows you to select all the clusters within a resource group.
Add to monitoring
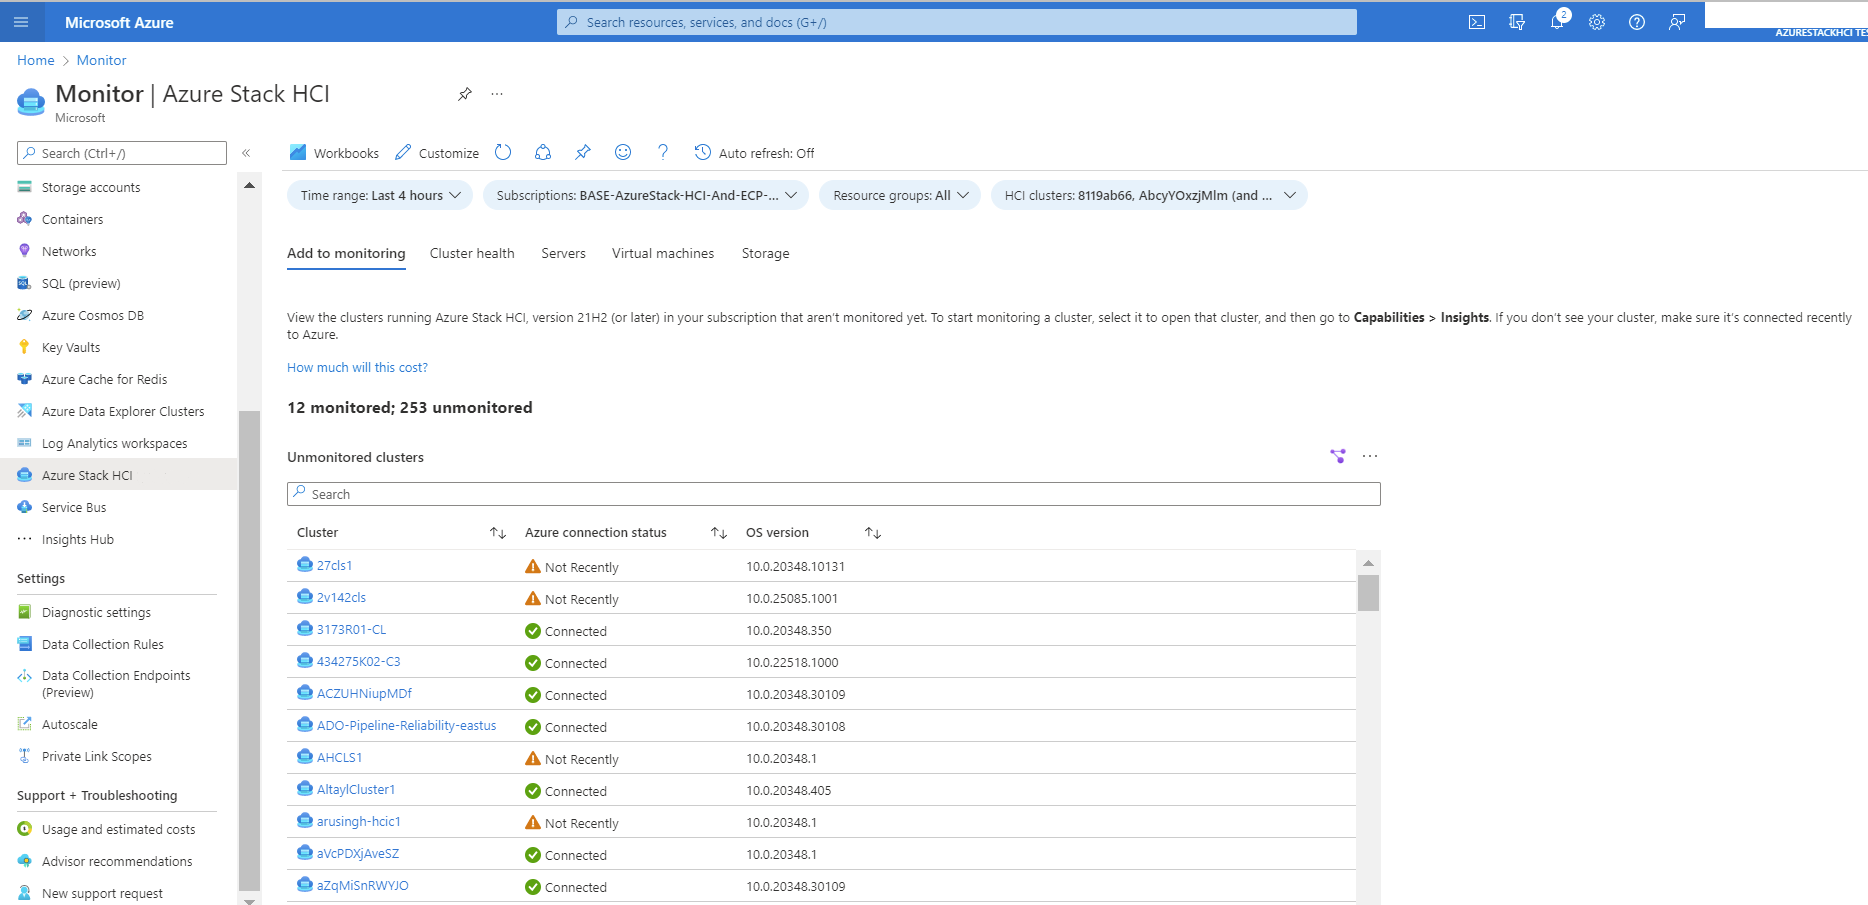
This feature provides details of clusters that are not monitored by the user. To start monitoring a cluster, select it to open that cluster, and then select Capabilities > Insights. If you don't see your cluster, make sure it has recently connected to Azure.
| Column | Description | Example |
|---|---|---|
| Cluster | The name of the cluster. | 27cls1 |
| Azure connection status | The HCI resource status. | Connected |
| OS version | The operating system build on the server. | 10.0.20348.10131 |
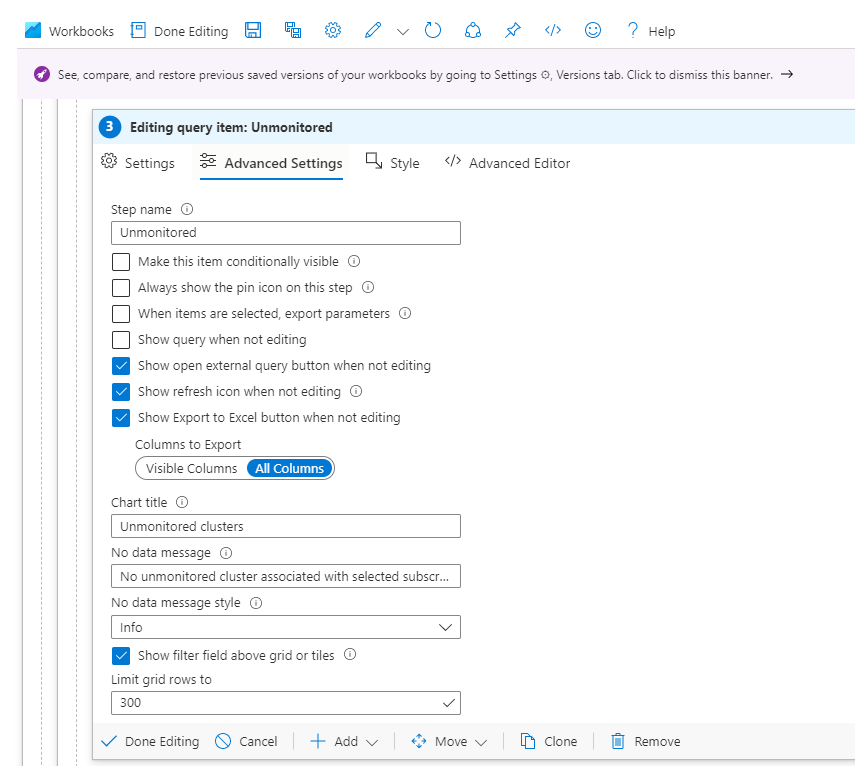
By default, the grid view shows the first 250 rows. You can set the value by editing the grid rows as shown in the following image:
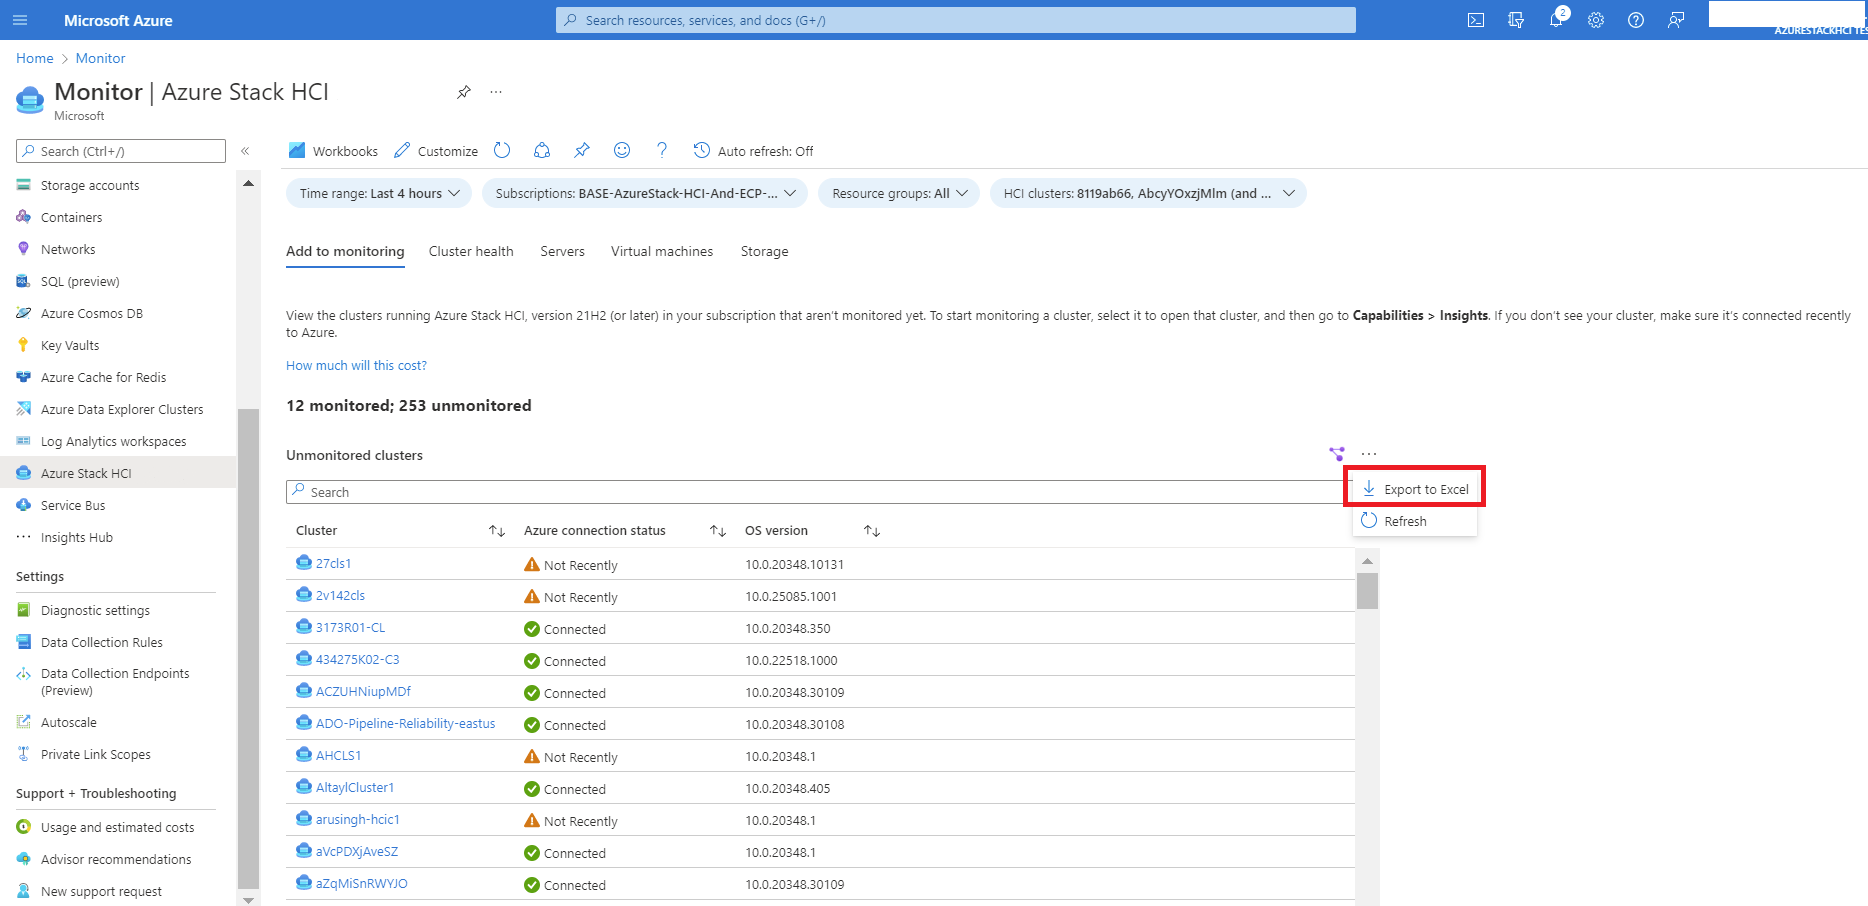
You can export the details in Excel by selecting Export to Excel as shown in the following image:
Excel will provide Azure connection status as follows:
- 0: Not Registered
- 1: Disconnected
- 2: Not Recently
- 3: Connected
Cluster health
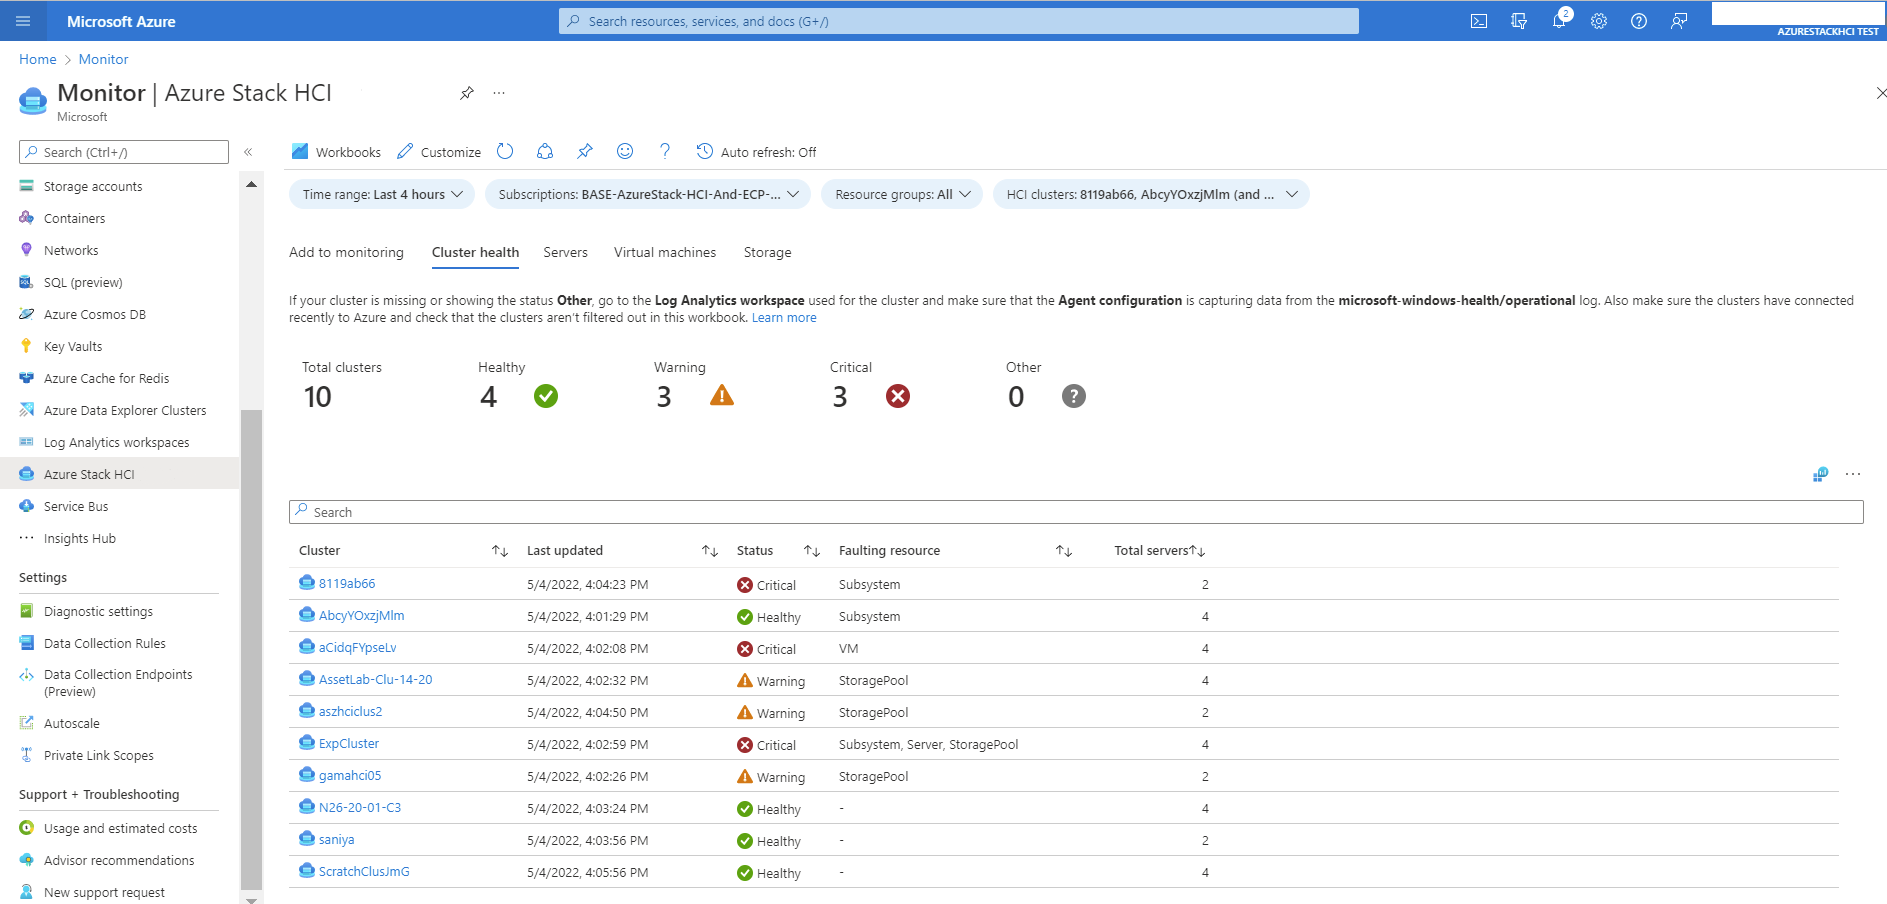
This view provides an overview of the health of clusters.
| Column | Description | Example |
|---|---|---|
| Cluster | The name of the cluster. | 27cls1 |
| Last updated | The timestamp of when server was last updated. | 4/9/2022, 12:15:42 PM |
| Status | Provides health of server resources in the cluster. It can be healthy, warning, critical, or other. | Healthy |
| Faulting resource | Description of which resource caused the fault. | Server, StoragePool, Subsystem |
| Total servers | The number of servers within a cluster. | 4 |
If your cluster is missing or showing the status Other, go to the Log Analytics workspace used for the cluster and make sure that the Agent configuration is capturing data from the microsoft-windows-health/operational log. Also make sure the clusters have connected recently to Azure, and check that the clusters aren't filtered out in this workbook.
Server
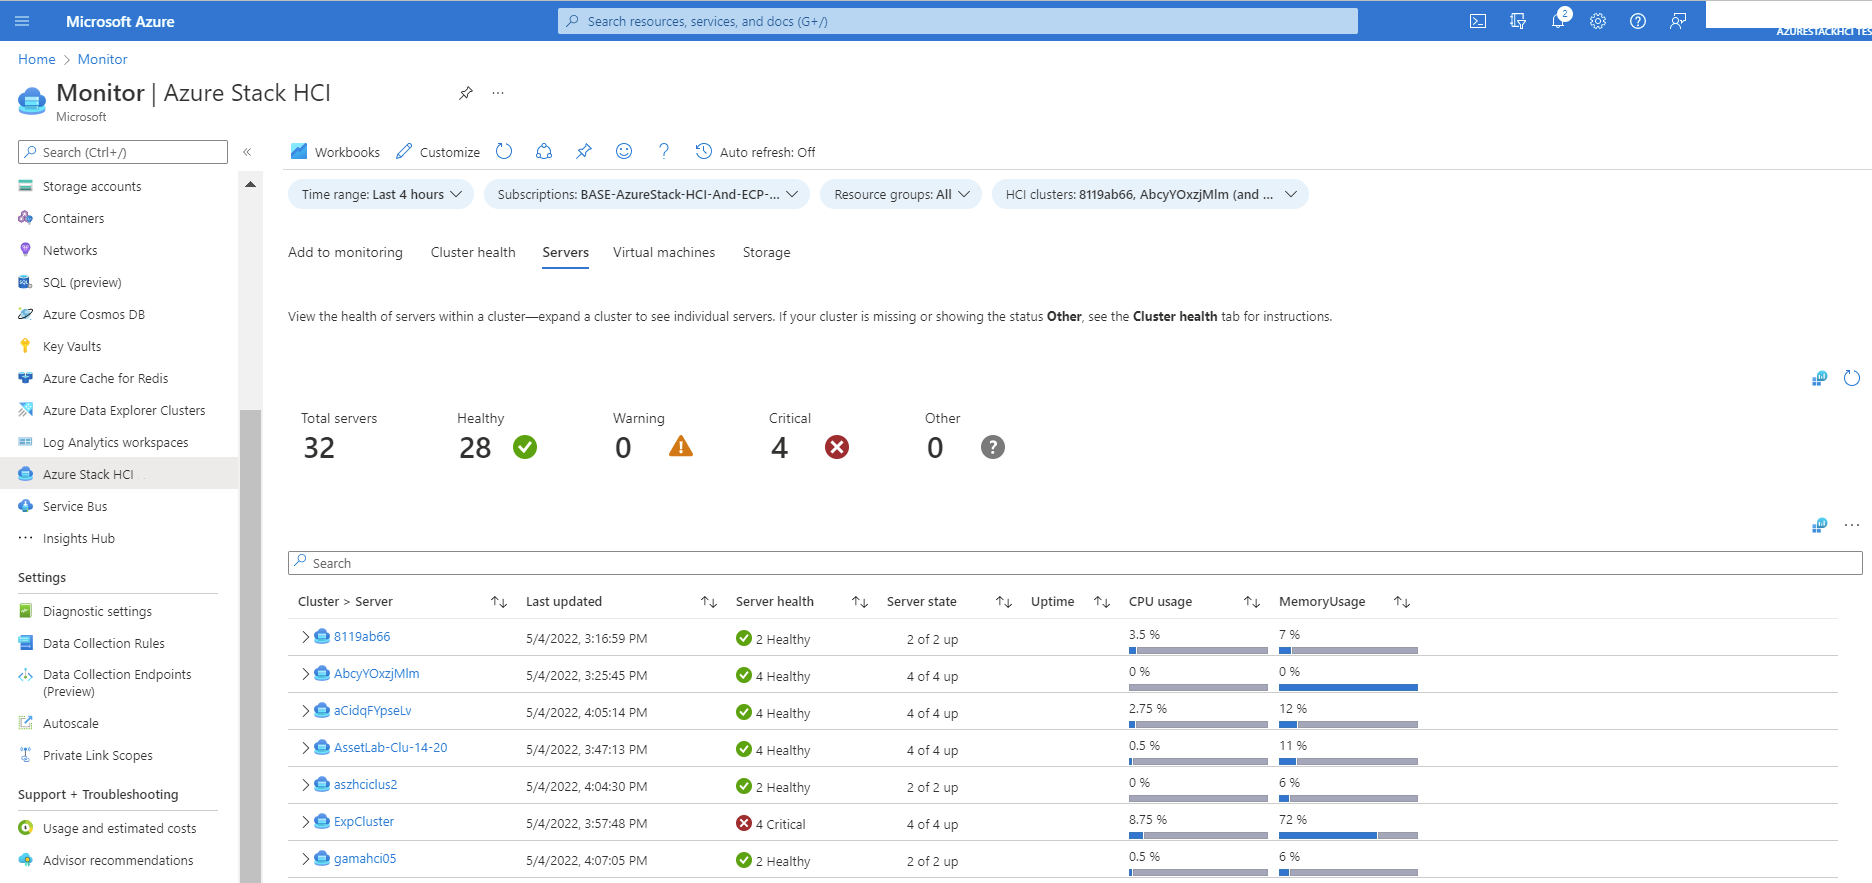
This view provides an overview of server health and performance, and usage of selected clusters. This view is built using the server event ID 3000 of the Microsoft-Windows-SDDC-Management/Operational Windows Event Log Channel. Each row can be further expanded to see the node health status. You can interact with the cluster and server resource to navigate to the respective resource page.
Virtual machines
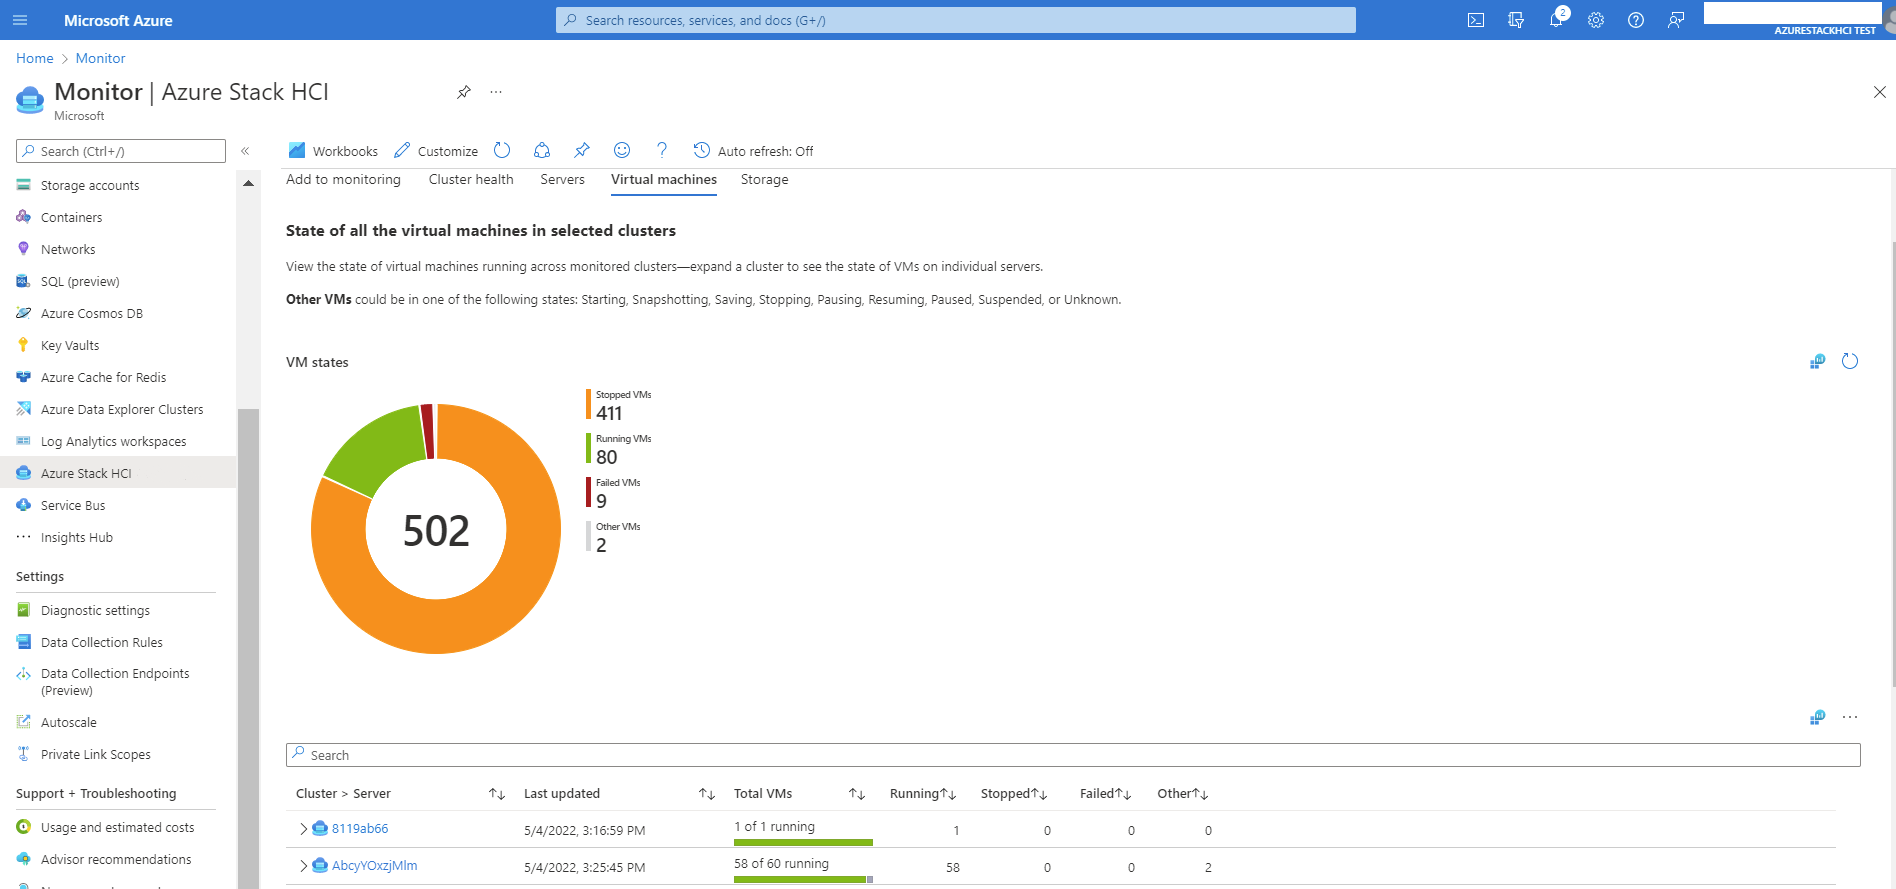
This view provides the state of all the VMs in the selected cluster. The view is built using the virtual machine event ID 3003 of the Microsoft-Windows-SDDC-Management/Operational Windows Event Log Channel. Each row can be further expanded to view the distribution of VMs across servers in the cluster. You can interact with the cluster and node resource to navigate to the respective resource page.
| Metric | Description | Example |
|---|---|---|
| Cluster > Server | The name of the cluster. On expansion, it shows the servers within the cluster. | Sample-VM-1 |
| Last Updated | The datetimestamp of when the server was last updated. | 4/9/2022, 12:24:02 PM |
| Total VMs | The number of VMs in a server node within a cluster. | 1 of 2 running |
| Running | The number of VMs running in a server node within a cluster. | 2 |
| Stopped | The number of VMs stopped in a server node within a cluster. | 3 |
| Failed | The number of VMs failed in a server node within a cluster. | 2 |
| Other | If VM is in one of the following states (Unknown, Starting, Snapshotting, Saving, Stopping, Pausing, Resuming, Paused, Suspended), it is considered as "Other." | 2 |
Storage
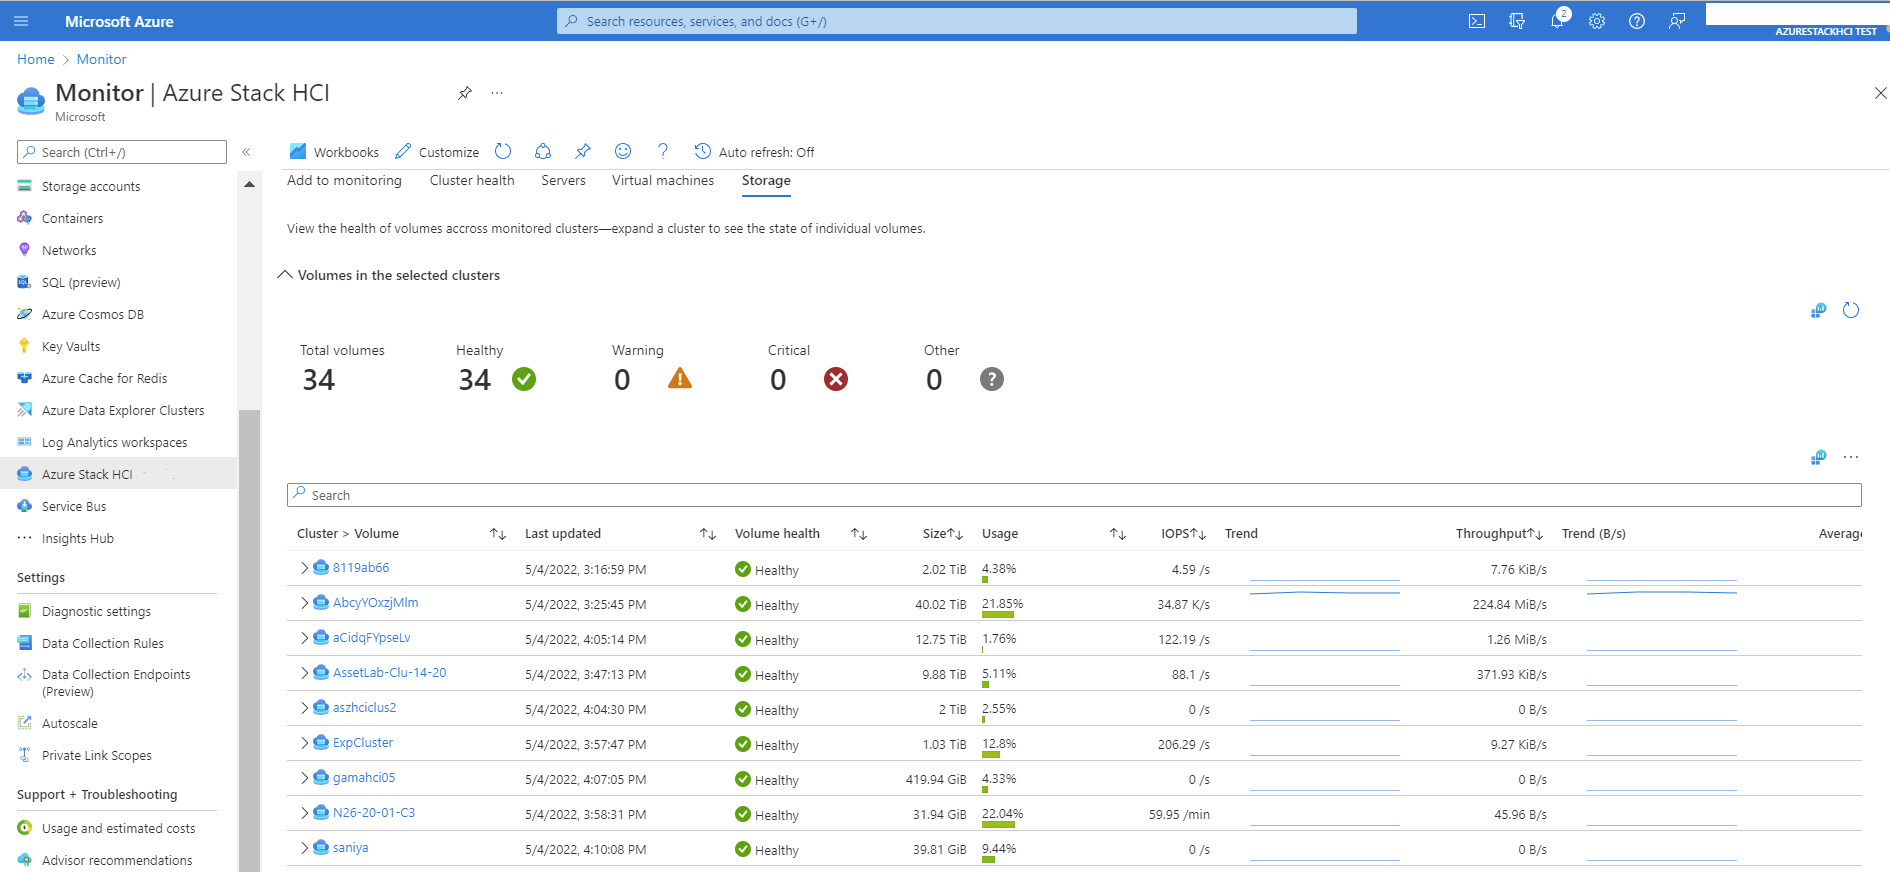
This view shows the health of volumes, usage, and performance across monitored clusters. Expand a cluster to see the state of individual volumes. This view is built using the volume event ID 3002 of the Microsoft-Windows-SDDC-Management/Operational Windows Event Log Channel. The tiles on the top provide an overview of the health of storage.
| Metric | Description | Example |
|---|---|---|
| Cluster > Volume | The name of the cluster. On expansion, it shows the volumes within a cluster. | AltaylCluster1 > ClusterPerformanceHistory |
| Last updated | The datetimestamp of when the storage was last updated. | 4/14/2022, 2:58:55 PM |
| Volume health | The status of the volume. It can be healthy, warning, critical, or other. | Healthy |
| Size | The total capacity of the device in bytes during the reporting period. | 25B |
| Usage | The percentage of available capacity during the reporting period. | 23.54% |
| Iops | Input/output operations per second. | 45/s |
| Trend | The IOPS trend. | |
| Throughput | Number of bytes per second the Application Gateway has served. | 5B/s |
| Trend (B/s) | The throughput trend. | |
| Average Latency | Latency is the average time it takes for the I/O request to be completed. | 334 μs |
Customize Insights
Because the user experience is built on top of Azure Monitor workbook templates, users can edit the visualizations and queries and save them as a customized workbook.
If you are using the visualization from Azure Monitor > Insights hub > Azure Stack HCI, select Customize > Edit > Save As to save a copy of your modified version to a custom workbook.
Workbooks are saved within a resource group. Everyone with access to the resource group can access the customized workbook.
Most queries are written using Kusto Query Language (KQL). Some queries are written using the Resource Graph Query. For more information, see the following articles:
Support
To open a support ticket for Insights, use the service type Insights for Azure Stack HCI under Monitoring & Management.
Event Log Channel
Insights and monitoring views are based on Microsoft-Windows-SDDC-Management/Operational Windows Event Log Channel. When monitoring is enabled, the data from this channel is saved to a Log Analytics workspace.
Viewing and changing the dump cache interval
The default interval to dump the cache is set to 3600 seconds (1 hour).
Use the following PowerShell cmdlets to view the cache dump interval value:
Get-ClusterResource "sddc management" | Get-ClusterParameter
Use the following cmdlets to change the frequency of cache dump. If set to 0 it will stop publishing events:
Get-ClusterResource "sddc management" | Set-ClusterParameter -Name CacheDumpIntervalInSeconds -Value <value in seconds>
Windows events in the log channel
This channel includes five events. Each event has cluster name and Azure Resource Manager ID as EventData.
| Event ID | Event type |
|---|---|
| 3000 | Server |
| 3001 | Drive |
| 3002 | Volume |
| 3003 | Virtual machine |
| 3004 | Cluster |
Server event 3000 RenderedDescription column value
{
   "m_servers":[
      {
         "m_statusCategory":"Integer",
         "m_status":[
            "Integer",
            "…"
         ],
         "m_id":"String",
         "m_name":"String",
         "m_totalPhysicalMemoryInBytes":"Integer",
         "m_usedPhysicalMemoryInBytes":"Integer",
         "m_totalProcessorsUsedPercentage":"Integer",
         "m_totalClockSpeedInMHz":"Integer",
         "m_uptimeInSeconds":"Integer",
         "m_InboundNetworkUsage":"Double (Bits/sec)",
         "m_OutboundNetworkUsage":"Double (Bits/sec)",
         "m_InboundRdmaUsage":"Double (Bits/sec)",
         "m_OutboundRdmaUsage":"Double (Bits/sec)",
         "m_site":"String",
         "m_location":"String",
         "m_vm":{
            "m_totalVmsUnknown":"Integer",
            "m_totalVmsRunning":"Integer",
            "m_totalVmsStopped":"Integer",
            "m_totalVmsFailed":"Integer",
            "m_totalVmsPaused":"Integer",
            "m_totalVmsSuspended":"Integer",
            "m_totalVmsStarting":"Integer",
            "m_totalVmsSnapshotting":"Integer",
            "m_totalVmsSaving":"Integer",
            "m_totalVmsStopping":"Integer",
            "m_totalVmsPausing":"Integer",
            "m_totalVmsResuming":"Integer"
         },
         "m_osVersion":"String",
         "m_buildNumber":"String",
         "m_totalPhysicalProcessors":"Integer",
         "m_totalLogicalProcessors":"Integer"
      },
      "…"
   ],
   "m_alerts":{
      "m_totalUnknown":"Integer",
      "m_totalHealthy":"Integer",
      "m_totalWarning":"Integer",
      "m_totalCritical":"Integer"
   }
}
Most variables are self-explanatory from this JSON information. However, the table below lists a few variables which are a bit harder to understand.
| Variable | Description |
|---|---|
| m_servers | Array of server nodes. |
| m_statusCategory | Health status of the server. |
| m_status | State of the server. It is an array that can contain one or two values. The first value is mandatory (0-4). The second value is optional (5-9). |
Values for the m_statusCategory variable are as follows:
| Value | Meaning |
|---|---|
| 0 | Healthy |
| 1 | Warning |
| 2 | Unhealthy |
| 255 | Other |
Values for the m_status variable are as follows:
| Value | Meaning |
|---|---|
| 0 | Up |
| 1 | Down |
| 2 | In maintenance |
| 3 | Joining |
| 4 | Normal |
| 5 | Isolated |
| 6 | Quarantined |
| 7 | Draining |
| 8 | Drain completed |
| 9 | Drain failed |
| 0xffff | Unknown |
Drive event 3001 RenderedDescription column value
Drive event 3001
{
    "m_drives":[
        {
            "m_uniqueId":"String",
            "m_model":"String",
            "m_type":"Integer",
            "m_canPool":"Boolean",
            "m_sizeInBytes":"Integer",
            "m_sizeUsedInBytes":"Integer",
            "m_alerts":{
                "m_totalUnknown":"Integer",
                "m_totalHealthy":"Integer",
                "m_totalWarning":"Integer",
                "m_totalCritical":"Integer"
            }
        },
        "…"
    ],
    "m_correlationId":"String",
    "m_isLastElement":"Boolean"
}
Volume event 3002 RenderedDescription column value
Volume event 3002
{
   "VolumeList":[
      {
         "m_Id":"String",
         "m_Label":"String",
         "m_Path":"String",
         "m_StatusCategory":"Integer",
         "m_Status":[
            "Integer",
            "…"
         ],
         "m_Size":"Integer (Bytes)",
         "m_SizeUsed":"Integer (Bytes)",
         "m_TotalIops":"Double (Count/second)",
         "m_TotalThroughput":"Double (Bytes/Second)",
         "m_AverageLatency":"Double (Seconds)",
         "m_Resiliency":"Integer",
         "m_IsDedupEnabled":"Boolean",
         "m_FileSystem":"String"
      },
      "…"
   ],
   "m_Alerts":{
      "m_totalUnknown":"Integer",
      "m_totalHealthy":"Integer",
      "m_totalWarning":"Integer",
      "m_totalCritical":"Integer"
   }
}
Most variables are self-explanatory from the above JSON information. However, the table below lists a few variables which are a bit harder to understand.
| Variable | Description |
|---|---|
| VolumeList | Array of volumes. |
| m_StatusCategory | Health status of volume. |
| m_Status | State of the volume. It is an array that can contain one or two values. The first value is mandatory (0-4). The second value is optional (5-9). |
Values for the m_statusCategory variable are as follows:
| Value | Meaning |
|---|---|
| 0 | Healthy |
| 1 | Warning |
| 2 | Unhealthy |
| 255 | Other |
Values for the m_status variable are as follows:
| Value | Meaning |
|---|---|
| 0 | Unknown |
| 1 | Other |
| 2 | OK |
| 3 | Needs repair |
| 4 | Stressed |
| 5 | Predictive failure |
| 6 | Error |
| 7 | Non-recoverable error |
| 8 | Starting |
| 9 | Stopping |
| 10 | Stopped |
| 11 | In service |
| 12 | No contact |
| 13 | Lost communication |
| 14 | Aborted |
| 15 | Dormant |
| 16 | Supporting entity in error |
| 17 | Completed |
| 18 | Power mode |
| 19 | Relocating |
| 0xD002 | Down |
| 0xD003 | Needs resync |
Virtual machine event 3003 RenderedDescription column value
Virtual machine event 3003
{
   "m_totalVmsUnknown":"Integer",
   "m_totalVmsRunning":"Integer",
   "m_totalVmsStopped":"Integer",
   "m_totalVmsFailed":"Integer",
   "m_totalVmsPaused":"Integer",
   "m_totalVmsSuspended":"Integer",
   "m_totalVmsStarting":"Integer",
   "m_totalVmsSnapshotting":"Integer",
   "m_totalVmsSaving":"Integer",
   "m_totalVmsStopping":"Integer",
   "m_totalVmsPausing":"Integer",
   "m_totalVmsResuming":"Integer",
   "m_alerts":{
      "m_totalUnknown":"Integer",
      "m_totalHealthy":"Integer",
      "m_totalWarning":"Integer",
      "m_totalCritical":"Integer"
   }
}
Cluster event 3004 RenderedDescription column value
Cluster event 3004
{
   "m_cpuUsage":"Double (%)",
   "m_totalVolumeIops":"Double",
   "m_averageVolumeLatency":"Double (Seconds)",
   "m_totalVolumeThroughput":"Double (Bytes/Second)",
   "m_totalVolumeSizeInBytes":"Integer",
   "m_usedVolumeSizeInBytes":"Integer",
   "m_totalMemoryInBytes":"Integer",
   "m_usedMemoryInBytes":"Integer",
   "m_isStretch":"Boolean",
   "m_QuorumType":"String",
   "m_QuorumMode":"String",
   "m_QuorumState":"String",
   "m_alerts":{
      "m_totalUnknown":"Integer",
      "m_totalHealthy":"Integer",
      "m_totalWarning":"Integer",
      "m_totalCritical":"Integer"
   }
For more information about the data that's collected, see Health Service faults.
Next steps
For related information, see:
