Monitor Azure Local features with Insights
Applies to: Azure Local 2311.2 and later
This article describes how to use Insights to monitor key Azure Local features, such as Resilient File System (ReFS) deduplication and compression.
To monitor Azure Local systems with Insights, see Monitor a single Azure Local system with Insights and Monitor multiple Azure Local systems with Insights.
About using Insights to monitor features
Insights for Azure Local collects logs for different Azure Local features, which are processed using Kusto Query Language (KQL), and then visualized using the Azure workbooks.
Enabling Insights on your Azure Local system provides access to a set of sample workbooks that you can use as-is or as a starting point to create custom workbooks. These workbooks help visualize the collected data and gain insights into the key Azure Local features, including:
- ReFS deduplication and compression. Monitor and analyze savings, performance impact, and jobs related to the ReFS deduplication and compression feature. See Monitor ReFS deduplication and compression.
Prerequisites
You must complete the following prerequisites before you can use Insights for monitoring Azure Local features:
You must have access to an Azure Local system that's deployed, registered, and connected to Azure.
Your system must be Arc-enabled and have Azure Monitor extension installed.
You must have Insights enabled on the system.
Monitor features with Insights
Follow these steps to monitor Azure Local features with Insights:
Make sure all the prerequisites are met.
In the Azure portal, browse to your Azure Local system resource page, and then select your cluster.
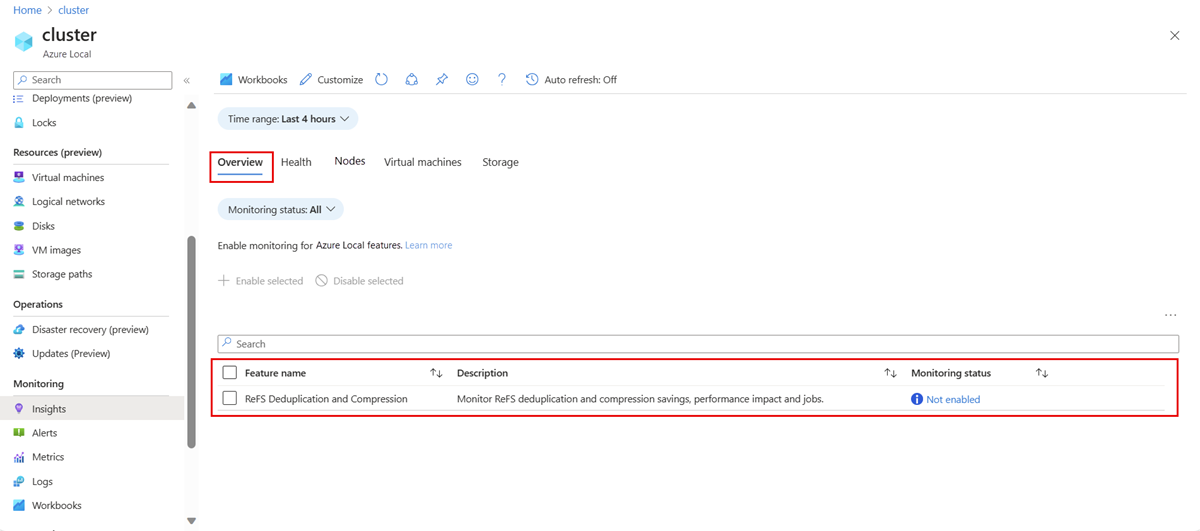
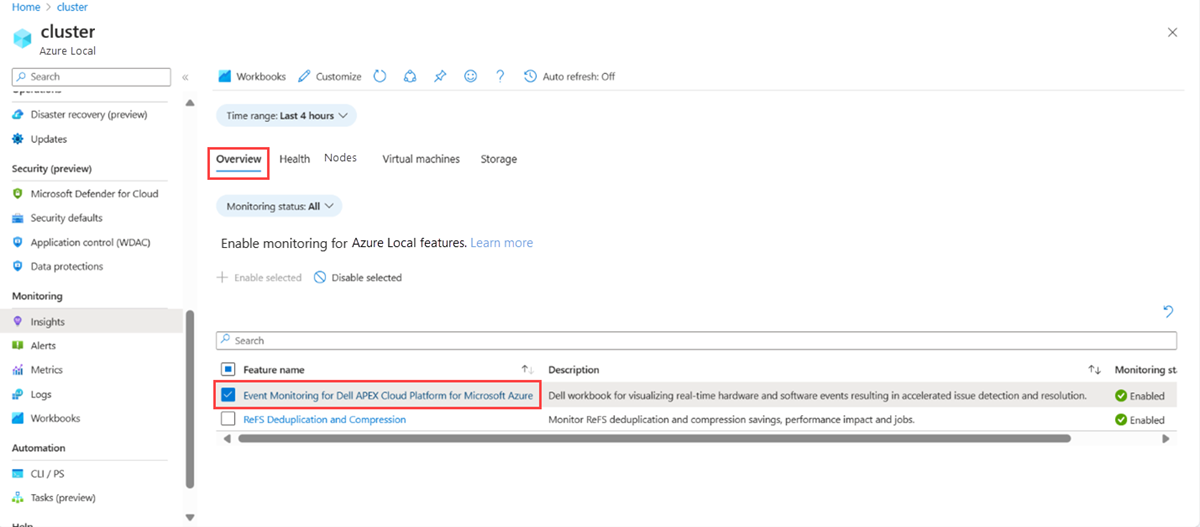
Select Insights from the left pane, and then select the Overview tab.
This tab provides a list of Azure Local features available for monitoring, along with descriptions of what is monitored, and the current monitoring status.
The following table describes the different monitoring statuses:
Monitoring status Description Enabled Indicates that monitoring is enabled for the feature. Insights collects log data from Windows events and performance counters related to the feature. Not enabled Indicates that monitoring is disabled for the feature, preventing data collection and insights. This is the default status. Needs update Indicates that there are some configuration issues that prevent Insights from collecting data. This can happen when the required events or data sources aren't correctly configured within the workbook. You must update Insights for the feature to successfully collect data.
Based on the monitoring status, you can perform one of these actions:
Enable monitoring for a feature. See Enable monitoring for a feature.
Disable monitoring for a feature. See Disable monitoring for a feature.
Enable or disable monitoring for multiple features. See Enable or disable monitoring for multiple features.
Update monitoring for a feature. See Update monitoring for a feature.
Enable monitoring for a feature
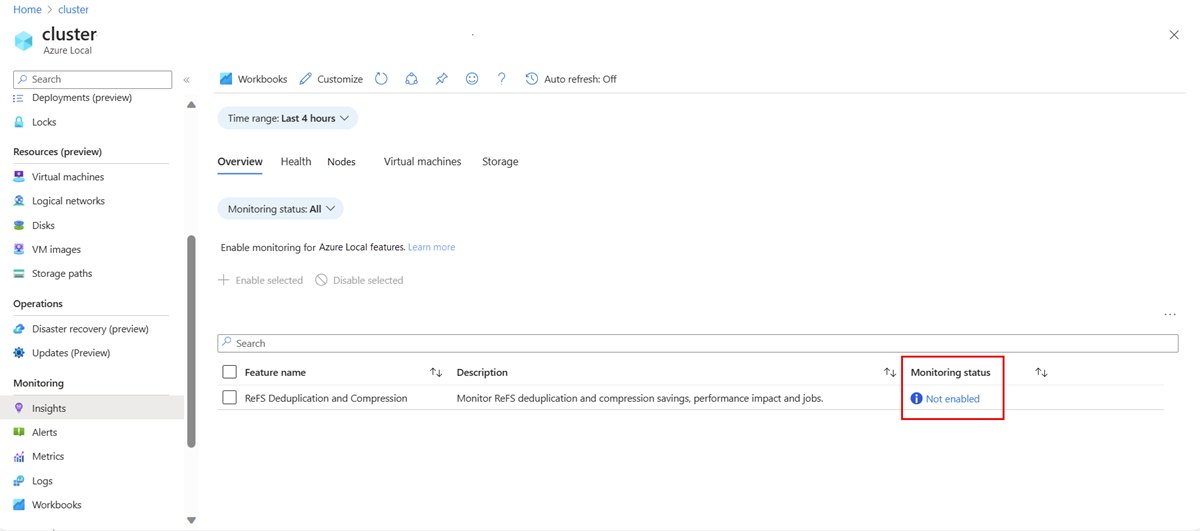
By default, monitoring for a feature isn't enabled and the monitoring status is displayed as Not enabled.
When you enable monitoring for a feature, Insights automatically adds the necessary performance counters and Windows event logs to the associated data collection rule (DCR) within the cluster. Once the DCR is configured, you receive a success message, and the feature name changes from plain text to a clickable link on the Overview tab.
Once you enable monitoring, it takes around 20-30 minutes for Insights to start collecting data and provide health, performance, and usage insights.
Follow these steps to enable monitoring for a feature:
On the Overview tab, select the feature with the Not enabled monitoring status.
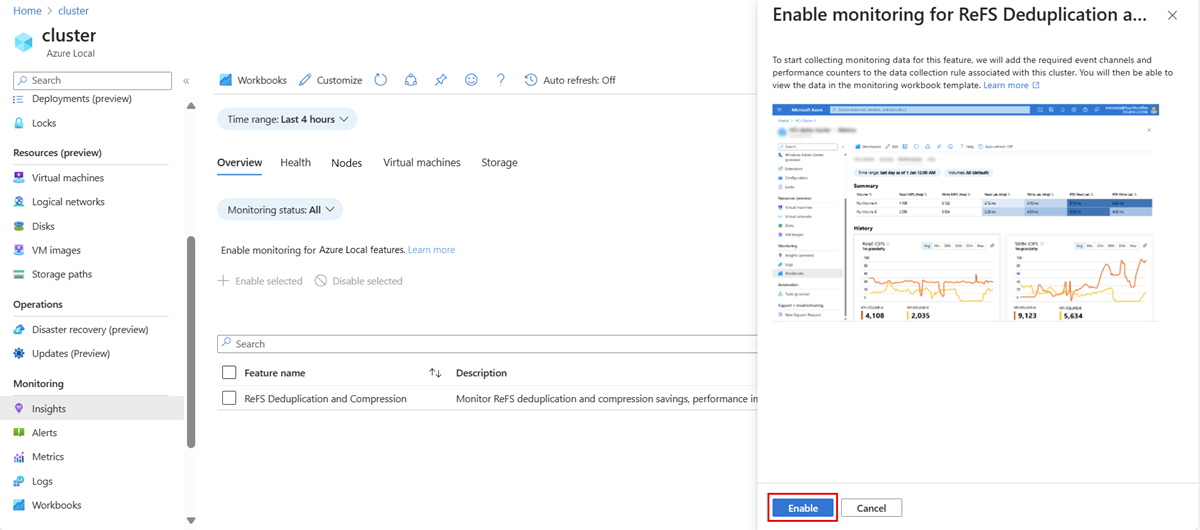
A context pane opens on the right that provides more details, such as a sample image of the workbook. Select the Enable button.
After you enable monitoring for a feature, the monitoring status for that feature changes from Not enabled to Enabled and its name changes from plain text to a clickable link. You can select the feature name to open its workbook.
Disable monitoring for a feature
By disabling monitoring for a feature, Insights stops collecting monitoring data associated with that feature. However, this action doesn't affect other event collection on this DCR or previously collected data.
Follow these steps to disable monitoring for a feature:
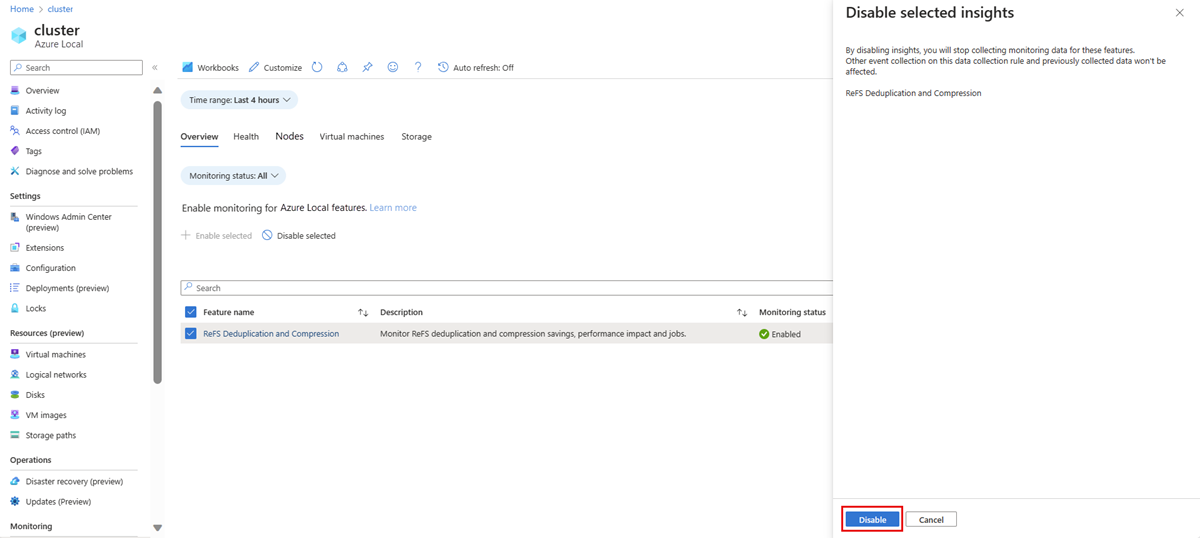
On the Overview tab, select the feature with the Enabled monitoring status.
On the Disable selected insights pane on the right, select the Disable button.
Enable or disable monitoring for multiple features
Follow these steps to enable or disable monitoring for multiple features simultaneously from the Overview tab.
On the Overview tab, select the checkboxes next to the desired features.
Select either Enable selected or Disable selected. The Enable selected insights or Disable selected insights pane appears on the right. It displays a list of features that you selected to enable monitoring or disable monitoring.
Select either the Enable or Disable button to enable or disable monitoring for all the selected features at once.
Update monitoring for a feature
On the Overview tab, if Monitoring status of a feature is displayed as Needs update, it indicates that there are some configuration issues preventing Insights to collect data.
Follow these steps to update Insights:
On the Overview tab, select the Needs update link for the feature with the Needs update monitoring status.
On the right pane, select the Needs update button to install the required configuration updates for Insights.
Monitor ReFS deduplication and compression
ReFS deduplication and compression is a storage capability that helps save storage space with minimal performance impact. It's a post-process solution and carries out block-level deduplication and compression at a fixed block size based on the system size. You can enable this feature on hybrid or all flash systems. It targets cache and capacity tiers. For more information about this feature, see Optimize storage with ReFS deduplication and compression in Azure Local.
Follow these steps to start monitoring the ReFS deduplication and compression feature:
Make sure the Prerequisites are met before you begin to use workbook. In addition, make sure you have at least one volume that has this feature enabled.
Enable monitoring for ReFS deduplication and compression. For instructions, see Enable monitoring for a feature.
Select the feature name from the Overview tab to open the workbook.
What data is collected?
Once you enable the ReFS deduplication and compression feature for monitoring, Insights starts collecting the following data:
| Data source | Data |
|---|---|
| Windows event channel | Microsoft-Windows-ReFSDedupSVC microsoft-windows-sddc-management/operational |
| Performance counters | CSVFS(*)/sec CSVFS(*)/sec CSVFS(*)Bytes/sec CSVFS(*)Bytes/sec CSVFS(*). sec/Read CSVFS(*). sec/Write |
The workbook for ReFS deduplication and compression comprises various tabs, each serving a specific functionality, as described in the following sections.
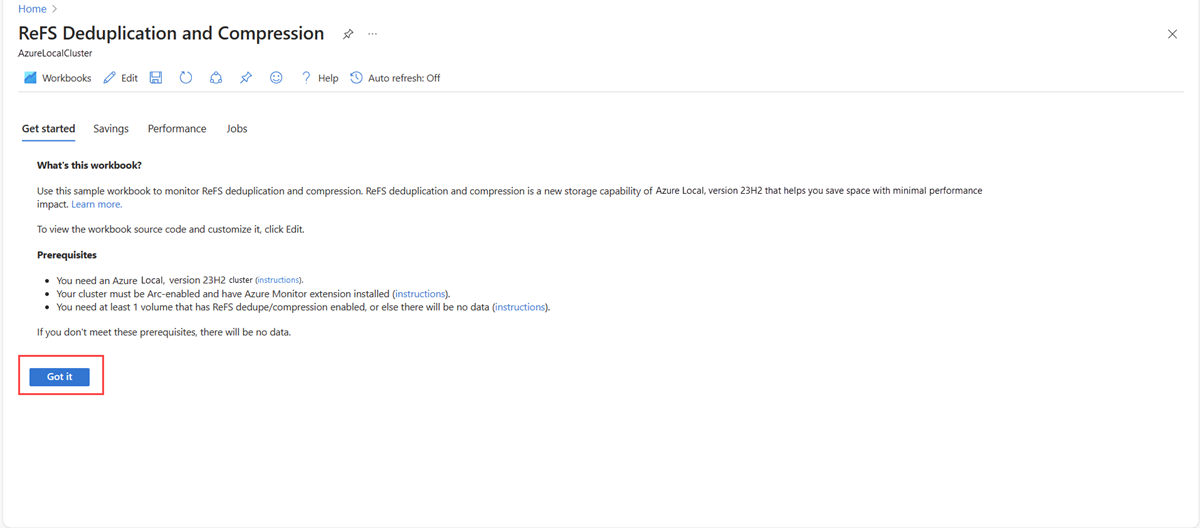
Get started
This tab gives basic information about the workbook and the prerequisites to view the workbook. Review the prerequisites and then select Got it to go to the next tab.
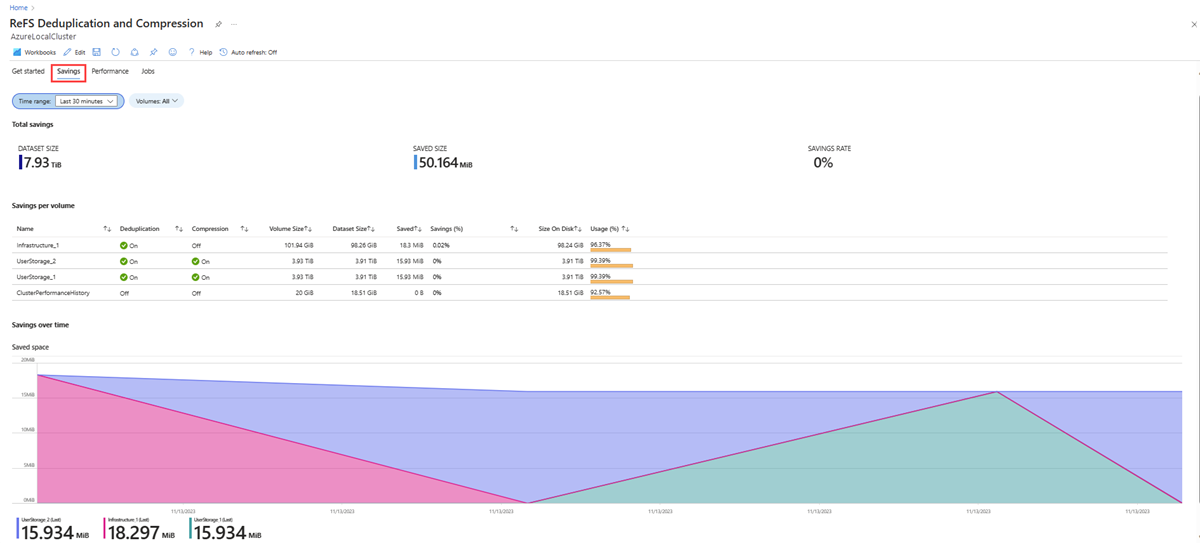
Savings
This tab provides volume information within a cluster and shows the savings for each volume.
The following table describes the columns under the Savings per volume section:
| Column | Description |
|---|---|
| Name | The name of the volumes in a cluster. |
| Deduplication | Indicates if deduplication is enabled (On) or not (Off). |
| Compression | Indicates if compression is enabled or not. |
| Volume Size | The size of the volume as specified by the user. |
| Dataset Size | The original size of data on the disk prior to any deduplication and compression optimizations. |
| Saved | The number of bytes saved on each volume. |
| Savings(%) | The saved space divided by the dataset size. |
| Size On Disk | The total amount of data stored on disk. |
| Usage (%) | The size on disk divided by the total volume size. |
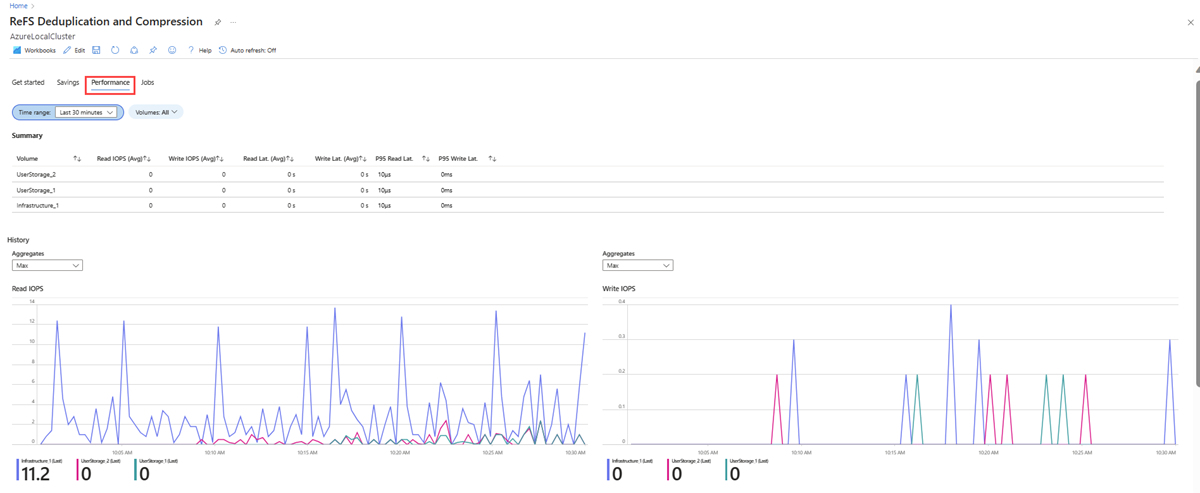
Performance
This tab provides details, such as read and write input/output operations/second (IOPS) for all the cluster shared volumes (CSV) on a cluster.
| Column | Description |
|---|---|
| Volume | Shows the different cluster shared volumes (CSV) in a cluster. |
| Read IOPS (Avg) | Gives the average value of input output read operations on a volume. |
| Write IOPS (Avg) | Gives the average value of input output write operations on a volume. |
| Read Lat. (Avg) | Gives the average value of read latency on a volume. |
| Write Lat. (Avg) | Gives the average value of write latency on a volume. |
| P95 Read Lat. | Gives the 95th percentile of read latency on a volume. |
| P95 Write Lat. | Gives the 95th percentile of write latency on a volume. |
You can select various aggregates like Average, P1st, P5th, P50th, P90th, P95th, 99th, Min, and Max for different metrics.
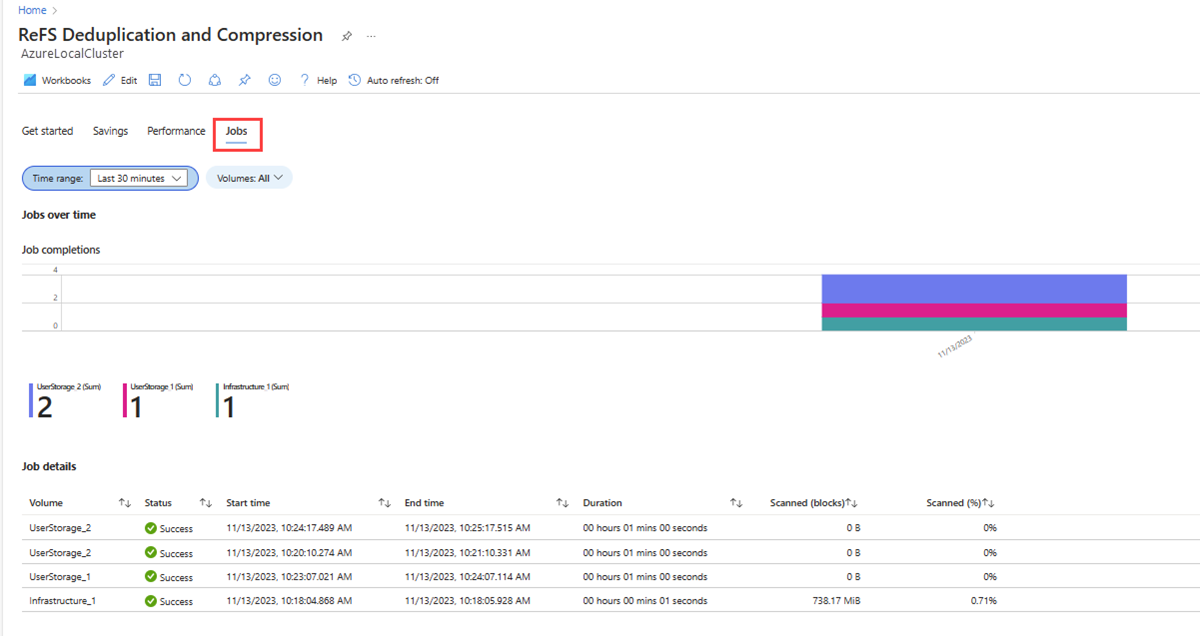
Jobs
This tab shows the jobs performed overtime during the deduplication process and a summary of the job details.
| Column | Description |
|---|---|
| Volume | Displays the different CSV in a cluster. |
| Status | Indicates the status (Success/Failed) of the ReFS deduplication. |
| Start time | Displays the time when ReFS deduplication started. |
| End time | Displays the time when ReFS deduplication completed. |
| Duration | Displays the total time taken for ReFS deduplication to finish. |
| Scanned blocks | Displays the total scanned blocks. |
| Scanned(%) | Displays the total scanned blocks divided by the total volume size. |
Troubleshoot ReFS deduplication and compression monitoring
Issue. No data appears on the ReFS deduplication and compression workbook.
Cause. Insights isn't able to collect logs for ReFS deduplication and compression.
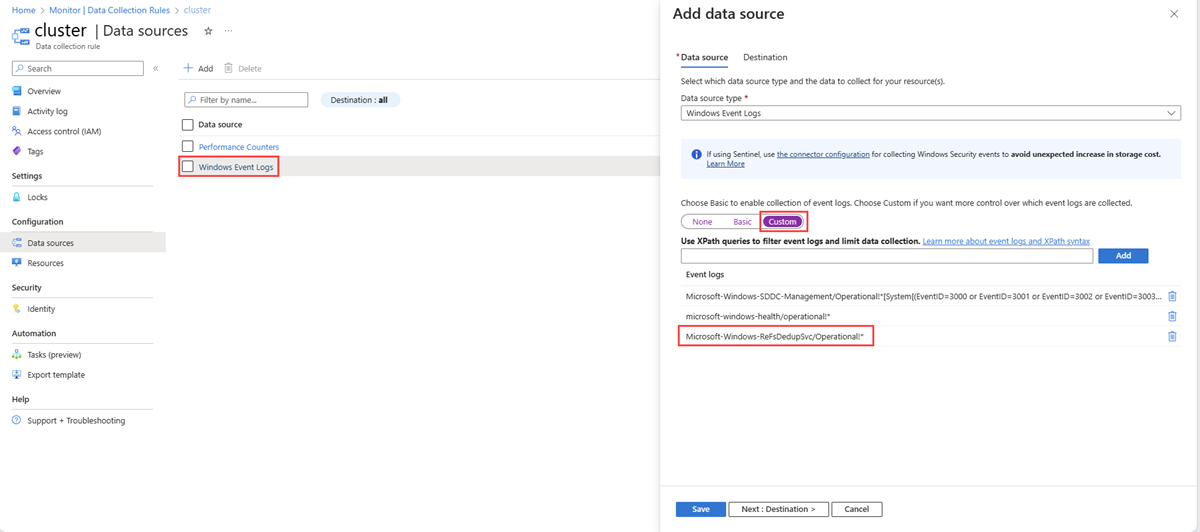
Solution. To confirm if the logs are being collected, follow these steps:
In the Azure portal, go to Monitor > Data Collection Rules.
Look for the data collection rule that is associated with your cluster, and then select Data sources.
Select the Windows Event Logs checkbox.
On the Add data source context pane on the right, under Data source, select Custom.
Verify if the
Microsoft-Windows-ReFSDedupSVCevent channel is listed, as shown in the following screenshot:
Monitor Dell APEX cloud platform
The Dell APEX cloud platform for Microsoft Azure offers a turnkey on-premises infrastructure solution that empowers organizations to unlock innovation through extensive integrations, automation, and a consistent Azure experience across their IT environments.
Use the Dell workbook to visualize hardware events in real-time, resulting in accelerated issue detection and resolution.
Follow these steps to start event monitoring for Dell APEX Cloud Platform for Microsoft Azure:
Make sure the Prerequisites are met before you begin to use workbook.
Enable monitoring for the Event Monitoring for Dell APEX Cloud Platform for Microsoft Azure feature. For instructions, see Enable monitoring for a feature.
Select the Event Monitoring for Dell APEX Cloud Platform for Microsoft Azure feature from the Overview tab to open the workbook.
For information about what data is collected and the different tabs on the workbook, see Event Monitoring for Dell APEX Cloud Platform for Microsoft Azure.
