Collect metrics for Istio service mesh add-on workloads for Azure Kubernetes Service in Azure Managed Prometheus
This guide explains how to set up and use Azure Managed Prometheus to collect metrics from Istio service mesh add-on workloads on your Azure Kubernetes cluster.
Prerequisites
Complete steps to enable the Istio add-on on the cluster as per documentation
Enable Azure Monitor managed service for Prometheus
Azure Monitor managed service for Prometheus collects data from Azure Kubernetes cluster. To enable Azure Monitor managed service for Prometheus, you must create an Azure Monitor workspace to store the metrics:
export AZURE_MONITOR_WORKSPACE=<azure-monitor-workspace-name>

export AZURE_MONITOR_WORKSPACE_ID=$(az monitor account create \
    --name $AZURE_MONITOR_WORKSPACE \
    --resource-group $RESOURCE_GROUP \
    --location $LOCATION \
    --query id -o tsv)
Enable Prometheus addon
To collect Prometheus metrics from your Kubernetes cluster, enable Prometheus addon:
az aks update --enable-azure-monitor-metrics --name $CLUSTER --resource-group $RESOURCE_GROUP --azure-monitor-workspace-resource-id $AZURE_MONITOR_WORKSPACE_ID
Customize scraping of Prometheus metrics in Azure Monitor managed service
Save the scrape config in a file named prometheus-config. This configuration enables pod annotation-based scraping, which allows Prometheus to automatically discover and scrape metrics from pods with specific annotations.
global:
  scrape_interval: 30s
scrape_configs:
- job_name: workload
  scheme: http
  kubernetes_sd_configs:
    - role: endpoints
  relabel_configs:
    - source_labels: [__meta_kubernetes_pod_annotation_prometheus_io_scrape]
      action: keep
      regex: true
    - source_labels: [__meta_kubernetes_pod_annotation_prometheus_io_path]
      action: replace
      target_label: __metrics_path__
      regex: (.+)
    - source_labels: [__address__, __meta_kubernetes_pod_annotation_prometheus_io_port]
      action: replace
      regex: ([^:]+)(?::\d+)?;(\d+)
      replacement: $1:$2
      target_label: __address__
To enable pod annotation-based scraping, create configmap ama-metrics-prometheus-config that references prometheus-config file in kube-system namespace.
kubectl create configmap ama-metrics-prometheus-config --from-file=prometheus-config -n kube-system
Verify Metric Collection
Configure access permissions: navigate to your Azure Monitor workspace in Azure portal and create role assignment for yourself to grant 'Monitoring Data Reader' role on the workspace resource.
Generate sample traffic: send a few requests to the product page created earlier, for example:
curl -s "http://${GATEWAY_URL_EXTERNAL}/productpage" | grep -o "<title>.*</title>"View/Query metrics in Azure portal: navigate to Prometheus explorer under your Azure Monitor workspace and query metrics. The example below shows results for query
istio_requests_total.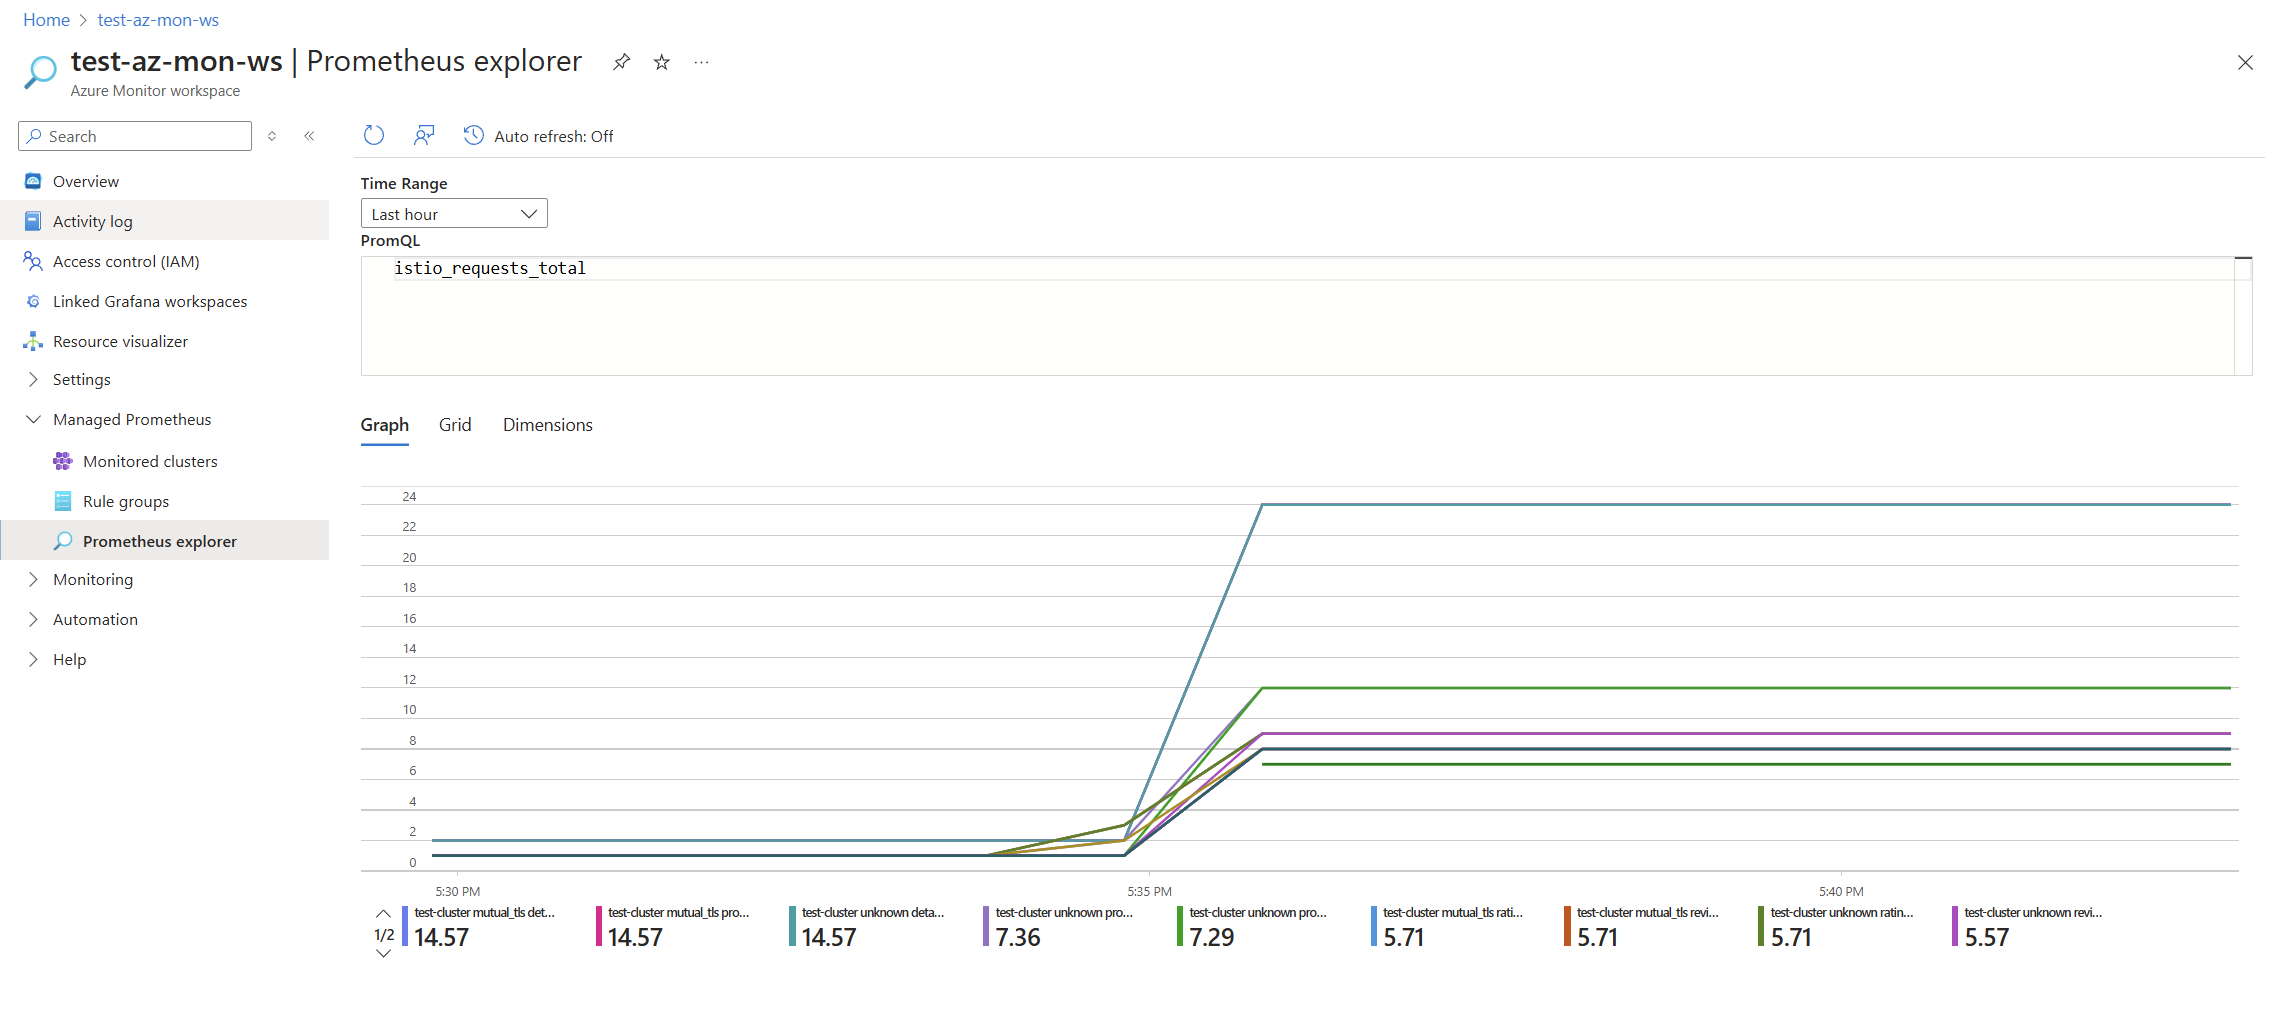

Delete resources
If you want to clean up the Istio service mesh and the ingresses (leaving behind the cluster), run the following command:
az aks mesh disable --resource-group ${RESOURCE_GROUP} --name ${CLUSTER}
If you want to clean up all the resources created from the Istio how-to guidance documents, run the following command:
az group delete --name ${RESOURCE_GROUP} --yes --no-wait

Azure Kubernetes Service