How to Visualize Azure Resource Metrics in Power BI
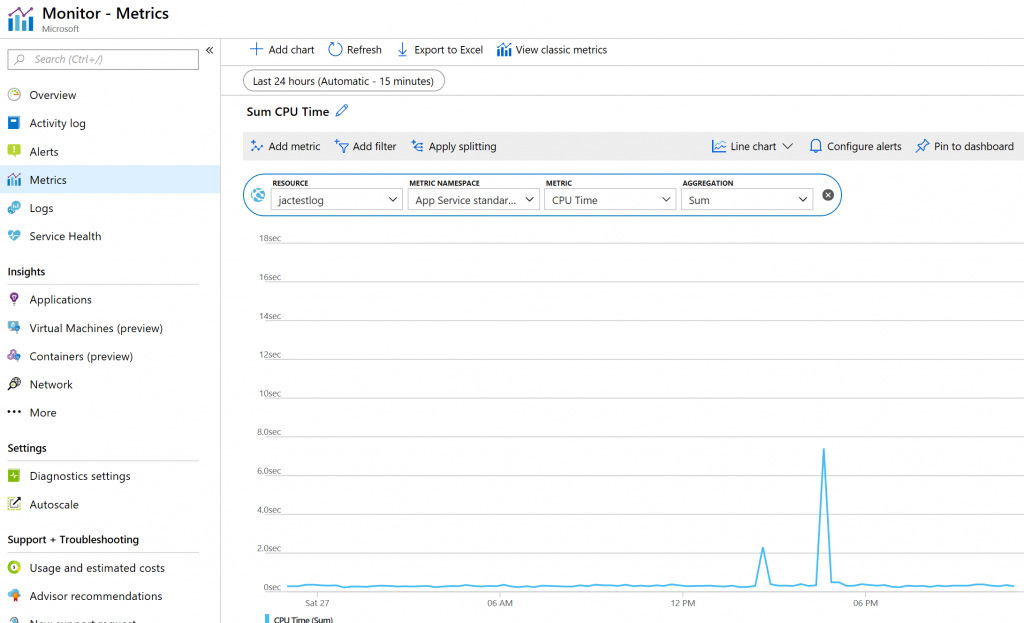
The ability to monitor all the azure resources' status is very important that makes the operator understand how all the services are going on. Azure monitor has provided rich visualization capability that we can monitor these services' metrics inside Azure Monitor blade or pin to dashboard.

On the other hand, as a widely used analysis service that provides rich visualization and report functionalities, there is also requirement to visualize these metrics in Power BI, then the operator can see the metrics in existing report as well. In order to make it, all we need is to create Log Analytics.

Basically, log data collected by Azure Monitor is stored in Log Analytics which collects telemetry and other data from a variety of sources and provides a query language for advanced analytics. Notice that Log Analytics was previously treated as its own service in Azure. It is now considered a part of Azure Monitor and focuses on storage and analysis of log data using its query language.
Next, we need connect the target azure resource with the log analytics. I have used a web app in the below example. Actually, almost all the azure services have been supported in log analytics and the supported metrics are documented in Supported metrics with Azure Monitor.

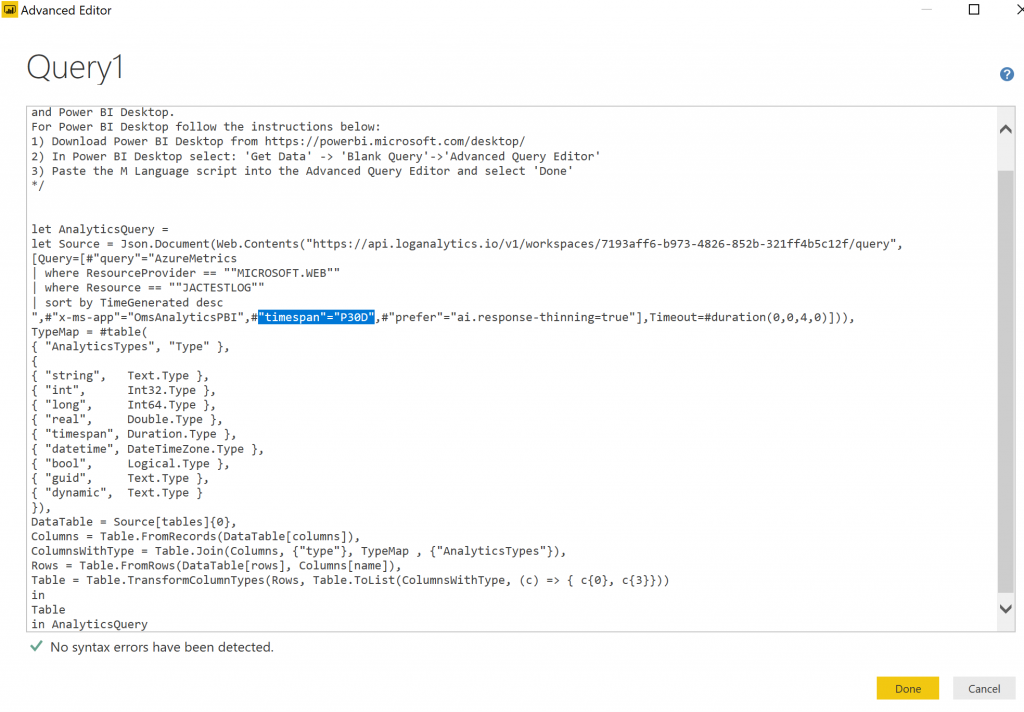
Navigate to the Log blade, we can query the metrics as we want, furthermore, export the query as Power Query (M) language shown below.

Now, we can open Power BI desktop, select Get Data > Blank Query to open a new query. Then select Advanced Editor and paste the contents of the exported file into the query. Notice that by default, the query is asking for data for past 1 day, feel free to update it per the requirement.

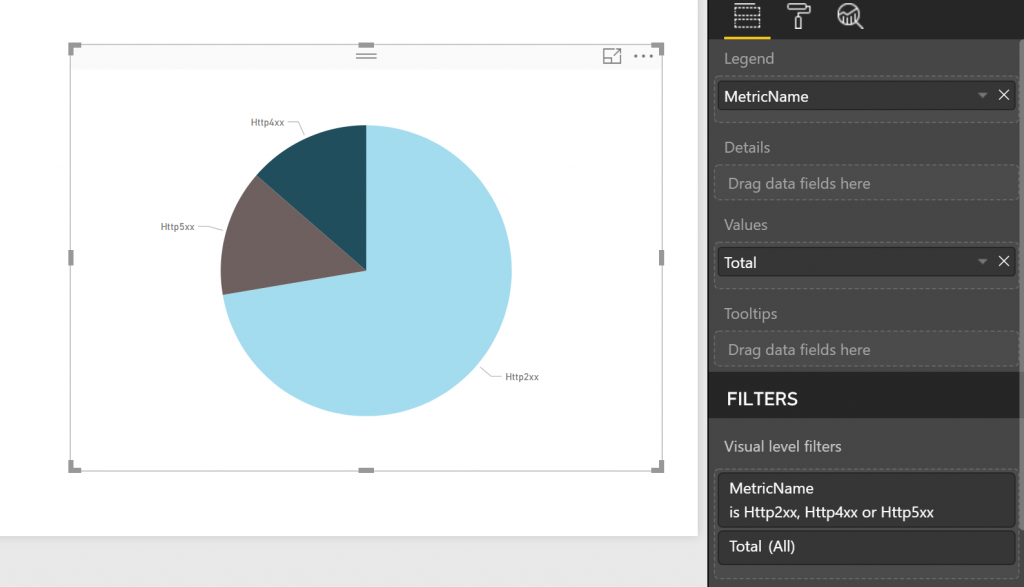
Lastly, based on the data imported, we can easily create the metrics chart as we want.

Comments
- Anonymous
October 28, 2018
Awesome