OMS: Collecting NRT Performance Data with an OpsMgr PowerShell Script Collection Rule (Created from a Wizard)
This post provides a detailed guide on how to create and configure a custom performance collection rule based on the PowerShell Script (Performance – OMS Bound) Rule Type, using a specific wizard, and enabling it to send it’s Near Real Time (NRT) collected data to a Microsoft Operations Management Suite workspace. (Refer to: New Sample PowerShell Collection Rule Wizards in the Ops Console)
The sample management pack bundle can now be downloaded from the TechNet Gallery.

I’ll like to give a big shout out to my colleague Marcin Jastrzebski ( Marcin@Work ), whom I thank for his support and guidance in helping me troubleshoot and complete my test cases while I was developing this custom solution for OMS.
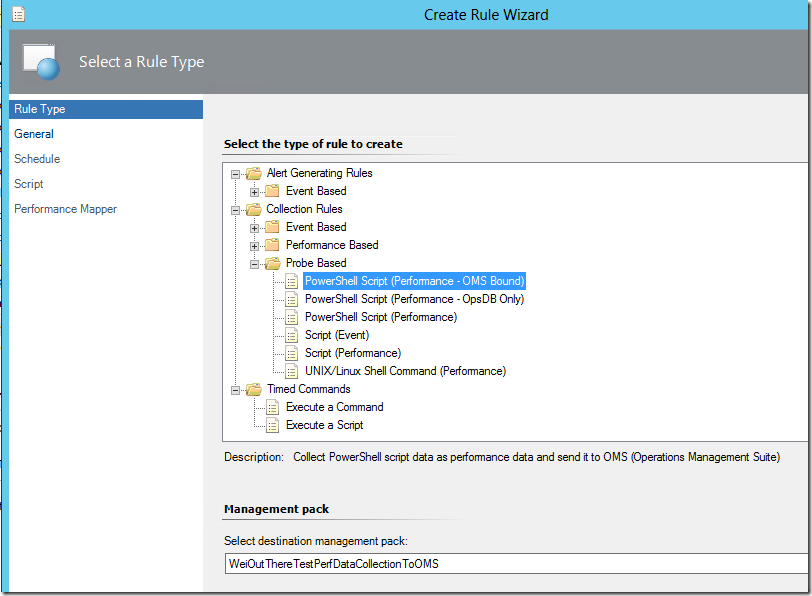
To create a custom NRT performance collection rule based on the PowerShell Script (Performance – OMS Bound) Rule Type after importing the management pack bundle, go to the Authoring Workspace of the Operations Console first.
Right-click on the Rules View under Management Pack Objects, and select the Create a new rule… option.

On the Rule Type page, select the PowerShell Script (Performance – OMS Bound) rule type under the Collection Rules\Probe Based folder, and specify the management pack to save the custom rule configuration:
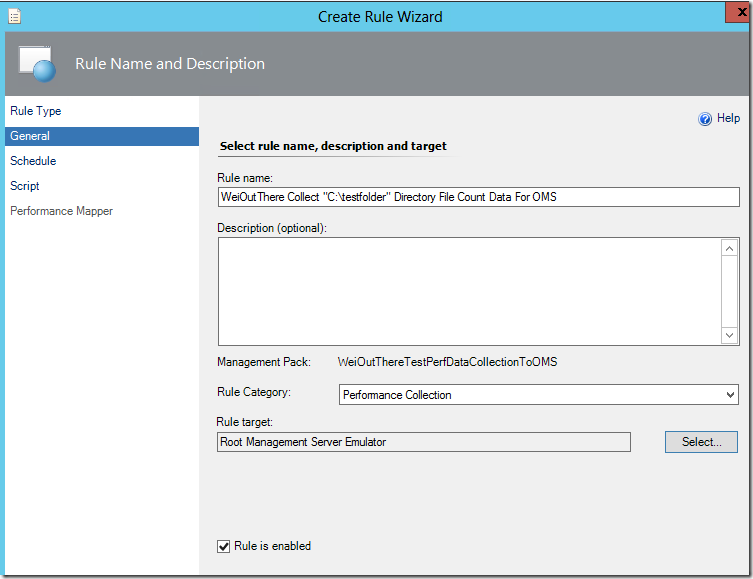
On the General Page, give the custom collection rule a meaningful name, select Performance Collection from the drop-down list, and select a target for the rule.
Important Notes: Make sure to be EXTRA CAUTIOUS on selecting the target for the collection rule as the rule will run on all instances of the targeted class to collect the script data to be sent to the OMS NRT endpoint.
In this example, the RMS Emulator class is used as it ensures that the rule runs on a single management server that is assuming the RMS Emulator role.
It is NOT recommended to target the rule at many-instance or general classes like Windows Server Operating System, Logical Disk (Server) , etc in a Production environment due to the volume of data that it would potentially generate, collected and impacting usage and billing metrics of the service.
For this reason, the “Rule is enabled” option does not work on the General pageregardless of whether it is checked or unchecked. This is a safety measure to ensure that custom rules created based on this rule type are disabled upon creation to avoid unnecessary submission of excessive data collected to OMS.
The rules generated from the wizard will need to be located and enabled after completing the wizard.
On the Schedule page, configure the sample interval for the collection rule:

On the Script page, enter the collection script (in PowerShell) and its timeout threshold and input parameters:
The simple PowerShell script used in this instance counts the number of files in the “C:\testfolder” directory and returns the value (count) to a PropertyBag that can later be referenced on the Performance Mapper page:
$API = new-object -comObject "MOM.ScriptAPI"
$PropertyBag = $API.CreatePropertyBag()
$FileCount = (Get-ChildItem C:\testfolder).Count
$PropertyBag.AddValue("CollectedData", [UInt32]$FileCount)
$PropertyBag

Refer to the following posts on how to specify Script Parameters via the Parameters option on Script page:
New Sample Wizard to Create PowerShell Monitors in the Ops Console
Using a Scriptblock in a PowerShell Monitor Created in the Ops Console
On the Performance Mapper page, the script data value collected can be retrieved from the property bag using this the right syntax:
$Data/Property[@Name=’CollectedData’]$
The ‘ellipsis’ buttons can be used to reference target variables:
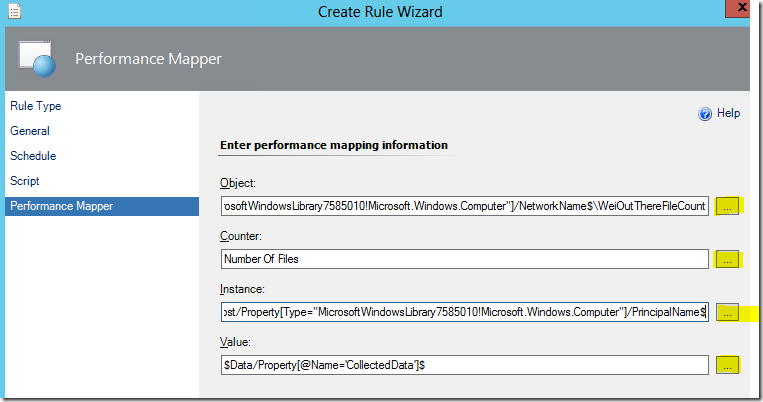
However, MOST IMPORTANTLY, the value specified in the Object name field MUST follow the \\FQDN\YourObjectName format:
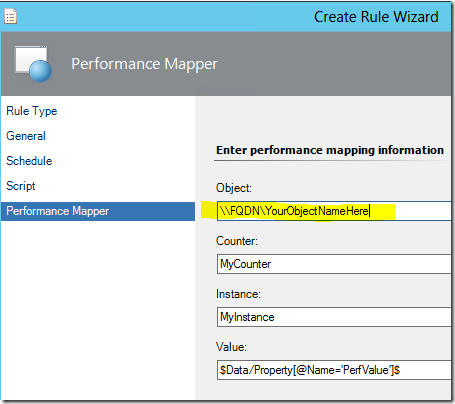
You can use the Network Name target variable for multi-instance class for the FQDN part, but it needs to be prefixed with a “\\” as follows:
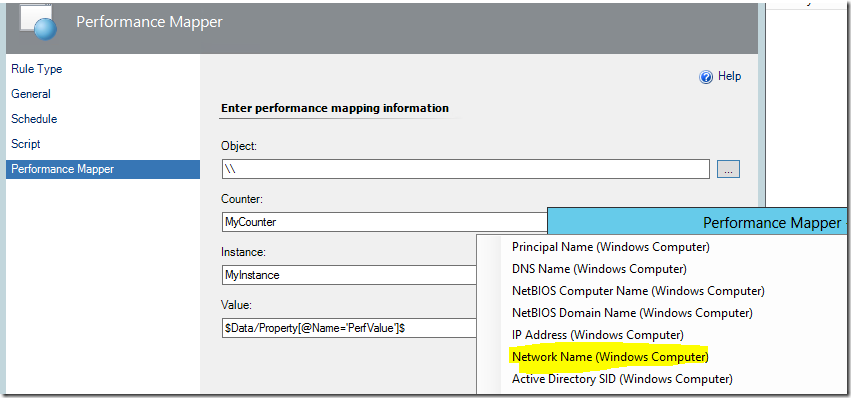
Completing the last page of the wizard and clicking the Create button will create two rules – one rule to collect aggregated script data and another to collect raw script data and both will be automatically disabled. Depending on which class was specified as a target during rule creation, both rules will need to be located in order to be turned on.
In this example, the target class used is the RMS Emulator.

Before enabling these rules through the Enable or Override option, its is absolutely recommended to do another round of checks to make sure that the configuration information is specified or typed correctly and in the right syntax and format.

Review the sample interval and the script used for the data collection:
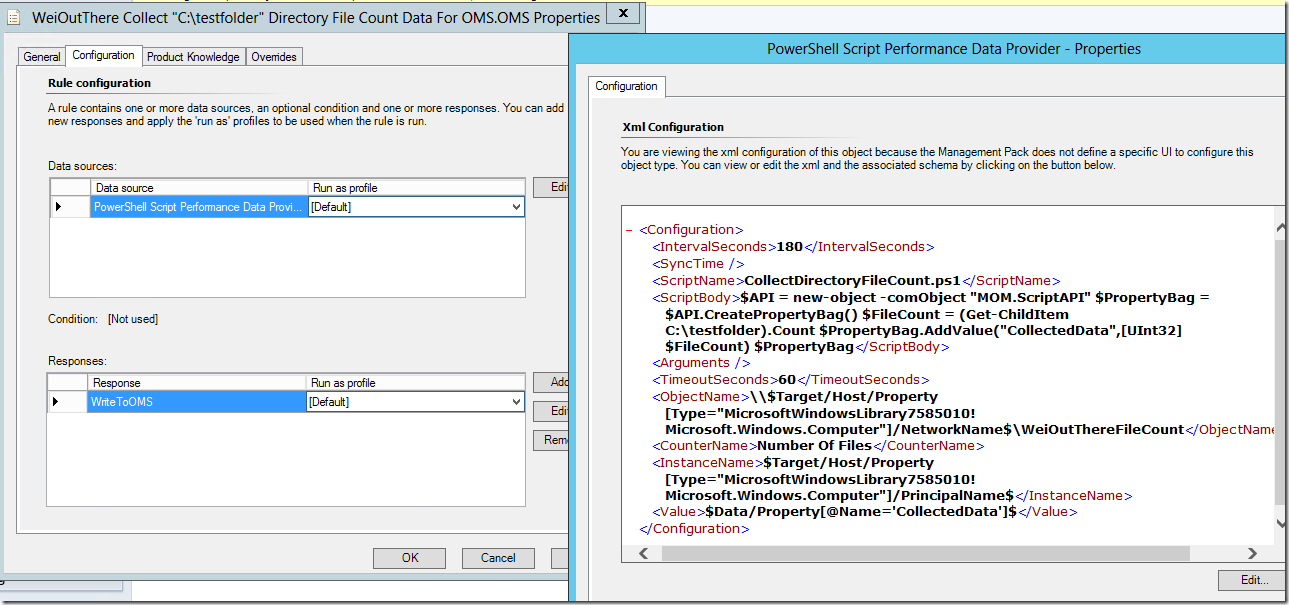
Again, make sure that the value specified in the ObjectName field follow the \\NetworkName\YourObjectName format:

After enabling these custom collection rules, BE PATIENT and wait for a few hours for the custom counter names to appear in your OMS workspace.
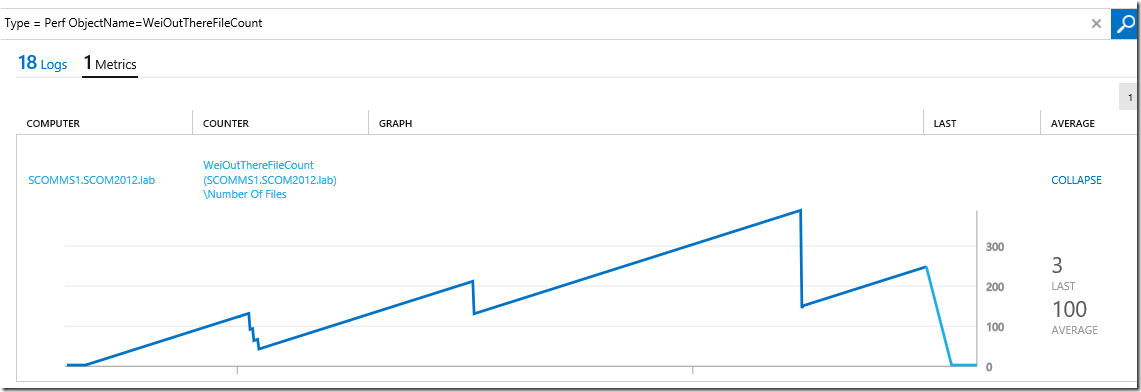
From then on, data should come in and update the performance chart in a NRT manner depending on how frequent the sample interval is configured in the collection rule:

Collapsed and filtered view:

Expanded and filtered view:
Additional Information:
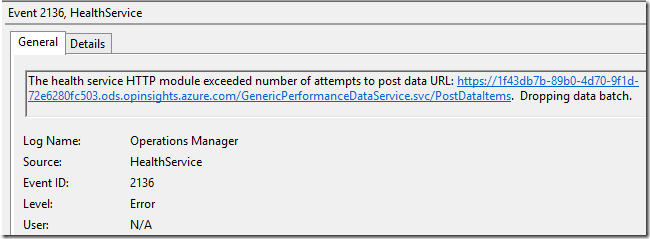
Error events 2127, 4502 are mainly caused by incorrect values used in the ObjectName field, hence ensure that they follow the follow the \ \NetworkName\YourObjectName format:


When Error events 2127, 4502 are present, Warning events 8000 and Error event 2136 can occur quite frequently in the Operations Manager event log of the server running the script of the custom performance collection rule:

Which machines are reporting to Azure Operational Insights? Where is my data coming from? What data and how much is it?
https://blogs.msdn.microsoft.com/dmuscett/2015/04/07/which-machines-are-reporting-to-azure-operational-insights-where-is-my-data-coming-from-what-data-and-how-much-is-it/
Near Real-time Performance Data Collection in OMS
https://blogs.technet.com/b/momteam/archive/2015/09/01/near-real-time-performance-data-collection-in-oms.aspx
Disclaimer:
All information on this blog is provided on an as-is basis with no warranties and for informational purposes only. Use at your own risk. The opinions and views expressed in this blog are those of the author and do not necessarily state or reflect those of my employer.
Comments
- Anonymous
September 28, 2015
Great article! Wei to go!