Capturing Unhandled Exception Dump
In this blog post, we are going to show how to use NP .NET Profiler to capture a memory dump on unhandled exception in Windows Store Applications. You can download the profiler tool from here.
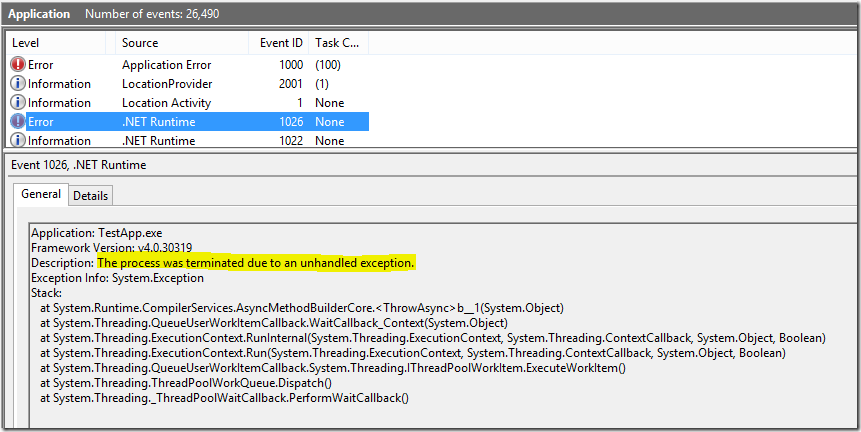
Whenever a Windows Store Application gets terminated due to an unhandled exception, .NET Runtime will log an event with the exception details and complete callstack as shown below.
Click the image for a larger view
Most of the time this callstack will help us to determine the location of the unhandled exception. But in few cases, the callstack doesn’t include any application functions, so it is very hard to pinpoint the location of the unhandled exception. And sometimes only with the callstacks information, it is very hard to determine the root cause of the unhandled exception.
Memory dump just before the process termination will not only help us to determine the location of the unhandled exception but it also helps us to determine the root cause of the exception.
Steps to capture unhandled exception dump
Download NP .NET Profiler tool from here
Extract the NPStoreApp.zip file to c:\temp\np folder
Double click on the NPStoreApp.exe
Select the Windows Store Application from the listbox
Set the “Profiler Type” to “Performance Profiler”
Set the “Filter Type” to “Namespace Based Filter”
Set the “Filter Settings” to “Ignore System and Microsoft Namespaces”
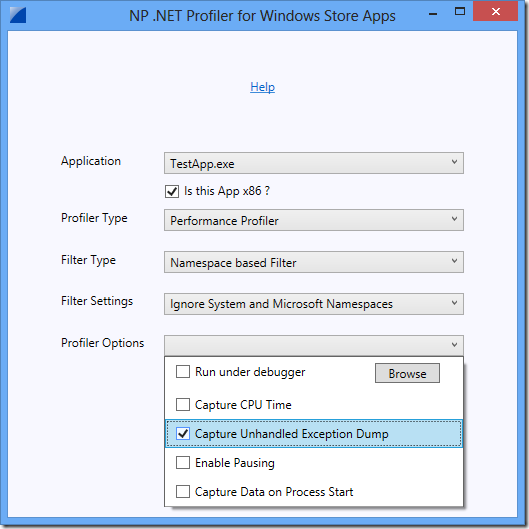
In the “Profiler Options” enable the “Capture Unhandled Exception Dump” as shown below
Click on the “Start Profiling” button. This will launch the application and the profiler will now monitor for unhandled exceptions.
Reproduce the unhandled exception
As soon as the unhandled exception is raised, the application gets terminated and just before termination, profiler captures a full memory dump
The memory dump file is saved to the temp folder. Just click on the “Open Output Folder” button to view the dump file location as shown below
Click the image for a larger view
Now open this memory dump file in WinDBG and execute following commands
- !symfix c:\websymbols
- .loadby sos clr
- !clrstack
- !dso
- !pe <exception object>
Here is the WinDBG output for these above commands
- !clrstack shows the exact callstack as captured in the eventlog
- !dso provides the address of the exception object that was not handled
- !pe provides the exception details and the callstack that raised the exception
- The location of the handled exception is : TestApp!TestApp.MainPage+<CrashTest>
- The root cause of the exception is : calling UI element from a worker thread
0:022> !clrstack
OS Thread Id: 0x270c (22)
Child SP IP Call Site
1191f8d4 0d96588c System.Runtime.CompilerServices.AsyncMethodBuilderCore.<ThrowAsync>b__1(System.Object)
1191f8dc 0d965846 System.Threading.QueueUserWorkItemCallback.WaitCallback_Context(System.Object)
1191f8e4 0d9630d7 System.Threading.ExecutionContext.RunInternal(System.Threading.ExecutionContext, System.Threading.ContextCallback, System.Object, Boolean)
1191f954 0d9629c7 System.Threading.ExecutionContext.Run(System.Threading.ExecutionContext, System.Threading.ContextCallback, System.Object, Boolean)
1191f968 0d96578a System.Threading.QueueUserWorkItemCallback.System.Threading.IThreadPoolWorkItem.ExecuteWorkItem()
1191f97c 0d961884 System.Threading.ThreadPoolWorkQueue.Dispatch()
1191f9cc 0d9616a6 System.Threading._ThreadPoolWaitCallback.PerformWaitCallback()
1191fbf0 63412652 [DebuggerU2MCatchHandlerFrame: 1191fbf0]
0:022> !dso
OS Thread Id: 0x270c (22)
ESP/REG Object Name
1191EFDC 03fac65c System.Exception
0:022> !pe 03fac65c
Exception object: 03fac65c
Exception type: System.Exception
Message: The application called an interface that was marshalled for a different thread. (Exception from HRESULT: 0x8001010E (RPC_E_WRONG_THREAD))
InnerException: <none>
StackTrace (generated):
SP IP Function
00000000 00000001 Windows_UI_Xaml_64e0000!Windows.UI.Xaml.Controls.Primitives.ToggleButton.get_IsChecked()+0x2
11BDF18C 0D963892 TestApp!TestApp.MainPage+<CrashTest>d__22.MoveNext()+0x102
1191F8D4 0D96588C mscorlib!System.Runtime.CompilerServices.AsyncMethodBuilderCore.<ThrowAsync>b__1(System.Object)+0x34
1191F8DC 0D965846 mscorlib!System.Threading.QueueUserWorkItemCallback.WaitCallback_Context(System.Object)+0x3e
1191F8E4 0D9630D7 mscorlib!System.Threading.ExecutionContext.RunInternal(System.Threading.ExecutionContext, System.Threading.ContextCallback, System.Object, Boolean)+0xef
1191F954 0D9629C7 mscorlib!System.Threading.ExecutionContext.Run(System.Threading.ExecutionContext, System.Threading.ContextCallback, System.Object, Boolean)+0x17
1191F968 0D96578A mscorlib!System.Threading.QueueUserWorkItemCallback.System.Threading.IThreadPoolWorkItem.ExecuteWorkItem()+0x5a
1191F97C 0D961884 mscorlib!System.Threading.ThreadPoolWorkQueue.Dispatch()+0x1c4
1191F9CC 0D9616A6 mscorlib!System.Threading._ThreadPoolWaitCallback.PerformWaitCallback()+0x6
StackTraceString: <none>
HResult: 8001010e
Comments
- Anonymous
April 17, 2014
I tried this but it doesn't create the dump file automatically when the unhandled exception occurs. Any idea ?


