Monitoring your multiple Azure Web App instances
This article has been moved to its new location here: https://benperk.github.io/waws/2015/2015-11-monitoring-your-multiple-azure-web-app-instances.html
When you scale to more than a single instance of a Web App, it gets a little complicated to monitor or troubleshoot an issue. The complicated part is trying to find which of the instances are experiencing the problem. In many cases, a majority of the requests complete just fine, but from time to time, or for a specific set of clients, a request may fail more frequently than others, or even constantly. If you hear complaints from your
customers or see failures in your IIS logs, but then, when you access the Web App all is working fine, you are likely experiencing the symptoms of having one of your instances not working as expected.
The unavailability or inconsistet performace of the single instance can occurr for numerous reasons. For example, transient exceptions or that the application code follows an unexpected path on that given VM.
Requests to a Web App are managed by front ends running Application Request Router software, I wrote a number of articles about ARR here. By default, a client is bound to a specific instance for the life of their web session, this is often refered to as ARR Affinity. If you have multiple instances, requests to your Web App are balanced across all configured instances so that no single instance is over loaded, individual clients remain affinitized. Due to this load balancing, response times and performance are optimized.
So the question is, how do you find the instance which is not performing well? Let‘s do these things:
- Find all the instances that are running your Web App
- Find the instance that is not performing as expected
- Take an action to fix that specific instance
Find Azure Web App instances running
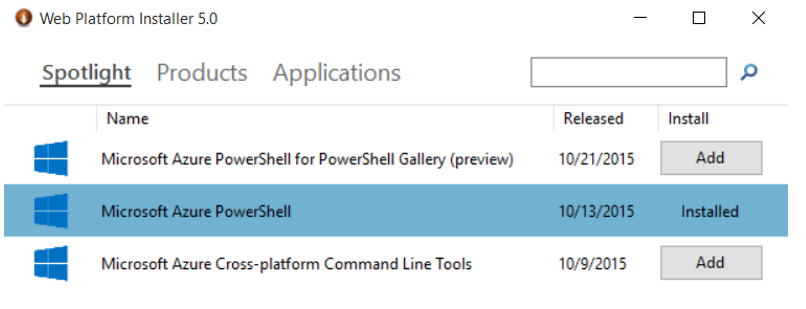
First you can install and use the Azure PowerShell cmdlets via the Web Platform Installer, as shown in Figure 1.
Figure 1, how to install the Azure PowerShell cmdlets
Once installed (you also need to have PowerShell installed too, in Figure 1 we just install the Azure cmdlets, I already had PowerShell installed), I like to use the Windows PowerShell ISE interface, because there is a lot of help and IntelliSense support in this IDE. I execute the following Azure PowerShell cmdlets to setup the IDE for the subscription that includes the Web App having the issue.
Get-AzurePublishSettingsFile
Import-AzurePublishSettingsFile .\*************credentials.publishsettings
Set-AzureSubscription -SubscriptionId "#####-####***…"
Get-AzureWebsite #Lists all Web Apps
Then, execute this command ‚Get-AzureWebsite -Name standard‘ to get detailed information about a Web App, which includes the instance Id, where standard is the name of your Web App. As shown in Figure 2, there are 3 instances (VMs) on which this Web App is running, circled.
Figure 2, Azure PowerShell to find Web App instances for troubleshooting
Find the specific instance having the problem
Once you have a list of all your instances, you can write a small app to monitor each of the specific Web Apps, I placed some sample code here, some of which is shown in Listing 1. I used this example as the seed for my creation of this method.
Listing 1, sample code to access a specific Web App instance
static void Main(string[] args)
{
var instances = new string[]
{
"b4ed1065a3557b5b4cb989f29e8ade38563ef1b7a3ef0dcfca258813f6b21147",
"c496b3e3a90e9b94304a876ae040c5cb348b746eae04c0fc8b6c8e87373ef09c",
"3b192aa8f3c7c04ebae20e2e12464a35b30e0620160f938a1b9faac82a271889"
};
var sitenames = new string[]
{
"SITE-1", "SITE-2", "SITE-n", "standard"
};
foreach (var site in sitenames)
{
var url = new Uri("https://" + site + ".azurewebsites.net/areYouOK.html");
foreach (var instance in instances)
{
var response = GetFromInstance(url, instance).Result;
WriteLine("Answer from site: " + site + " instance: " + instance);
WriteLine(response.Content.ReadAsStringAsync().Result);
WriteLine();
}
}
ReadLine();
}
Notice that in Listing 1, I have a string[] for my sitenames, this means that I have multiple Web Apps running on each of the multiple instances. You may have already isolated the issue to a specific Web App that is having the problem, so you might not want or need all the Web Apps, but if you are monitoring for availability, platform wide, then you would want to monitor them all.
Additionally, in Listing 1, I am requesting a specific file, ‚areYouOK.html‘, this file returns some silly text, but if coded to do so, it can perform some action as well. If the action is successful, then return an OK as the result, and for example, if the result is not OK, take a recovery action.
When you run the example code, the result is written to the console, in the event you get an unexpected outcome, note down the instance id so that you can take an action on that specific VM.
Take an action on that specific instance
You might already know that when you restart the Web App from the management console, that all of the instances are not recycled. At least this is how it is now. When you experience a problem, simply logging into the portal and clicking on the recycle/restart may not restart the Web App having the issue.
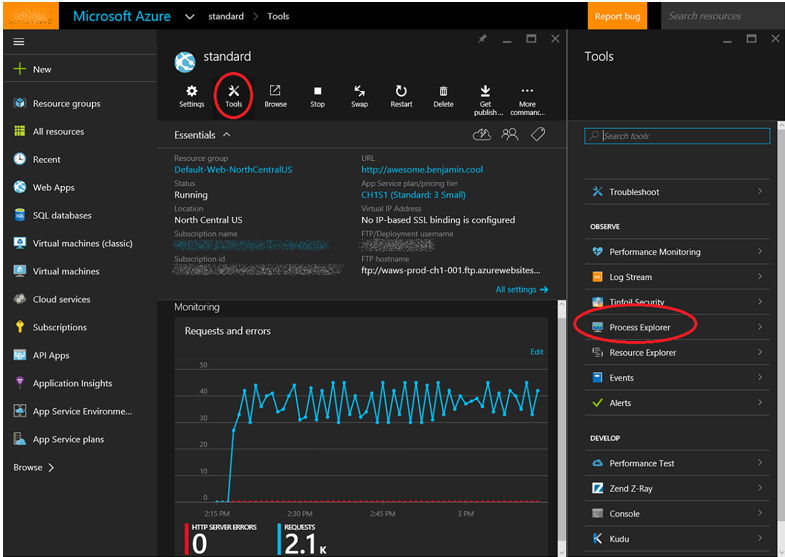
Therefore, as you now have the instance id for the VM having the problem, you can access the new Azure Management portal and view the processes running for your Web App on each of the instances. Click on your Web App, the Tools -> Process Explorer as shown in Figure 3.
Figure 3, Azure Web App process explorer multiple instances
Once you click on the Process Explorer, a journey similar to that shown in Figure 4 is rendered. Notice that the characters after the INSTANCE ID match the first 6 characters of the instances shown in Figure 2 previously.
Figure 4, Azure Web App instances
You can now see the instance specific W3WP process answering requests to your Web App. In some cases you might see, for example large memory consumption or a large number of threads. There are a few actions you can take now to resolve the issue with the specific instance. A relatively aggressive action is to take the instance id you found having the problem, find the corresponding instance id in the Processes list, and KILL it. Right-click on the W3WP process and select KILL, as shown in Figure 5. After the process is killed, when a new request is sent to the VM, a new W3WP process will start and answer the request.
Figure 5, kill the W3WP process on a specific Web App instance
Alternatively, you can look at the symptoms in more detail and setup Auto Healing, as per these instructions here. I have also had some success with Auto Healing which I wrote about here.
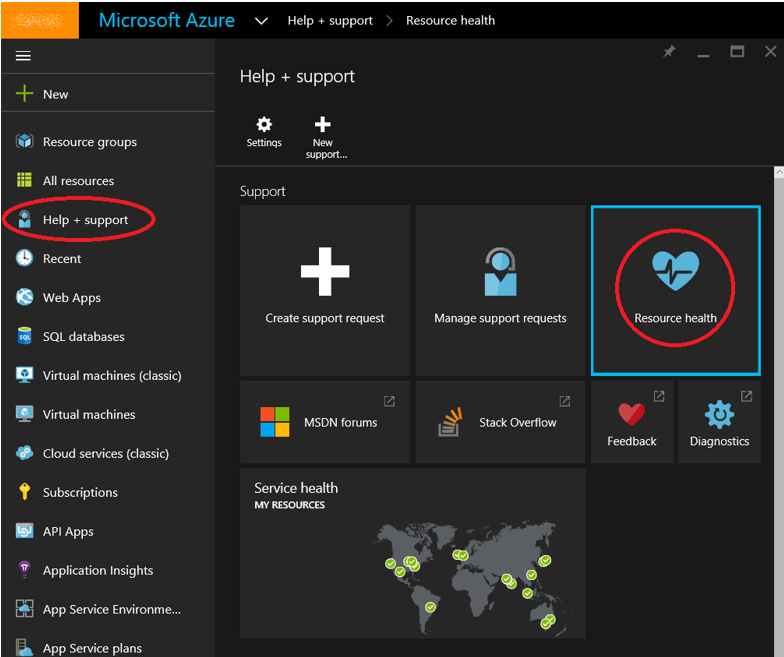
Lastly, if you would like some support from Microsoft, you can click on the Help + Support resource and then the Resource health feature to see if there may be a platform or application problem recognized by the monitoring. See Figure 6.
Figure 6, Monitor your Azure Web App and get support
Once you click on the Resource health icon, a list that shows the status of your Web Apps is rendered. Check the specific Web App and if it is not green then consider creating a support request, as in this case, the issue may be platform related.


