Troubleshooting Reporting Services at the Client Tier with Fiddler
SQL Server Reporting Services enables report developers to build and deploy reports quickly and without having to write complicated code. But this abstraction can come at a price. In general, most report developers either have no experience developing web applications or understand the behind the scenes mechanics of a web-based application like SSRS. Trouble-shooting slow loading web pages can be a frustrating experience for report developers if they don't have past experience dealing with web applications. Although it's relatively simple to see what SSRS is doing on the server side to process and render reports, tracking down problems on the client side can be difficult.
Let's start with a scenario where users are complaining that a particular report is taking a long time to display in the browser when the report URL is clicked in Report Manager. The report has no default values so it doesn't execute when opened. The users and management don't understand what's taking this report as long as 15-20 minutes just to open so it can be run.
I prefer to start with the base object in the SSRS hierarchy, the database. If the database isn't returning queries in a timely manner, nothing else is going to resolve the issue until the database is working properly. Since the report is not loading properly, we check the queries that populate the report parameters. There are several parameters that have a large number of possible values in this report. When we run the queries using Query Analyzer in Management Studio, the results are returned within a couple of seconds. This makes the issue with the report loading even murkier since SSRS should be able to run the parameter queries without a delay.
Since the problem with the report occurs before it is rendered, we can’t look at the execution log. At this point, the exasperated report development team manager might turn to the network support engineers for help. Their second response (after declaring that the network is performing just fine and dandy, thank you.) is to throw a network sniffer on the server’s network interfaces. They start trying to isolate and capture HTTP traffic to one of the client machines to see if they can trap the problem. But this can be a daunting task. Most network sniffers don’t make it easy to reassemble packets into holistic entities that the development team could correlate with what the report server is doing. After capturing several hundred megabytes of data, the network engineers throw in the towel and declare that it’s not their issue to resolve.
At this point, most report development teams might feel that all is hopeless and lost. Nothing in the database, the report server or the network appears to be causing the problem. Could it be the browser? That’s an obvious assumption given that the client machine is the only piece that hasn’t been declared fully functional. But how do you troubleshoot a browser problem on a client machine? The answer is to capture the network data on the client machine.
The best tool I’ve found yet is a utility named Fiddler. It is a useful tool that's used by web developers to trace IP traffic on the client. Fiddler is a web debugging proxy that logs and displays valuable information about what's going on between the browser and server. Fiddler is downloaded and installed on the client machine. When it is executed, it creates a local proxy that intercepts web traffic and displays metrics about response times, size and type of data and has viewers to display the actual data. Fiddler allows you to inspect all HTTP and HTTPS traffic, set breakpoints, and "fiddle" with incoming or outgoing data. Fiddler includes a powerful event-based scripting subsystem, and can be extended using any .NET language.
The Fiddler web site has plenty of information about setup, configuration and operation which I will not dig into in this article. There are also extensions for Fiddler. I installed one, neXtpert, which is a performance report generator. Although most of the functionality of neXpert is not needed for debugging SSRS, the annotation feature is helpful for denoting different phases of the test process.
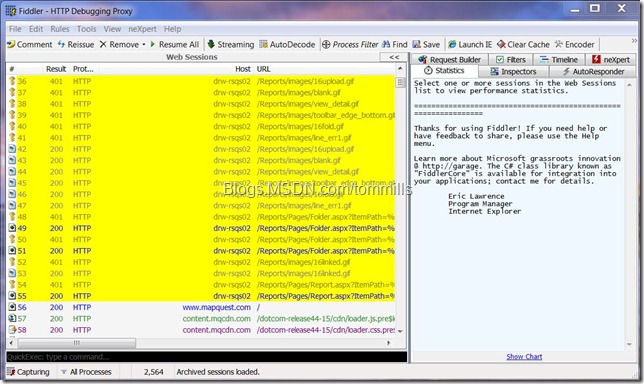
Here’s a screen capture from Fiddler. It shows a archive of a capture in the left hand pane with yellow highlighting of a set of sessions that are related to a report being loaded. This will give you a frame of reference as we discuss the use of Fiddler in detail.
Let’s get back to resolving our vexing report load problem. On the client machine, we open Fiddler. The tool creates a local proxy server that any application that connects to the web will use. This is an important point to remember for several reasons. First of all, Fiddler captures HTTP traffic from any application running on the machine. This includes email clients, web browsers, download managers, IM, social networking and even things like the Windows Sidebar (more on that later). Secondly, the application we want to test must use the Fiddler proxy. If the browser or application reads it’s web proxy settings from the Internet Options control panel and the “Automatically Detect Settings” option is checked there, you should not experience any problems. When the application sends out the WPAD request, it will find Fiddler and use it as it’s proxy server. If you are having problems capturing with Fiddler, this is a good starting point for troubleshooting.
As mentioned earlier, Fiddler captures traffic from any application on the client. There a couple of ways to fine tune what Fiddler captures. The quick and dirty way is to shut down everything on the machine except the browser. You’ll probably get most everything shut off but you might overlook something which may show up in your reports. I did this with Windows Sidebar. The report generated by the neXtpert extension included Sidebars use of cookies in one of the gadgets. The client who saw the report got a little freaked out that their internal server was accessing some external domain without their knowledge. Once I stopped laughing (not at them but at my ignorance) I explained to them the origin of the cookies and they understood what had happened. Point is, be careful about what your capturing. You can also configure Fiddler to restrict capture to a specific host and application. Filters can be set under the Filters tab in the right hand window. Note that there a lot of filter settings but most aren’t necessary for what we trying to accomplish. The last way to filter results is to use the highlight session feature to identify relevant sessions. This is useful if you forget to shut things down or filter. It can also be handy when you’re analyzing a saved capture.
When you’re ready to test, use Fiddler to clear the browser cache and then launch the browser. Navigate to the report server’s Report Manager home page. Find the problematic report in Report Manager. This is a good point to use neXtpert to annotate the test process. It will add a marker to the capture with your comments which will also show up in Fiddler’s generated timeline.
Click on the report’s URL and let the server and browser do their thing. When the report (finally) displays, annotate the completion in the neXtpert tab. Save the capture to a Fiddler archive from the File menu. If you’ve done a good job of filtering, you can save all sessions. If not, you can still highlight the sessions you want and save them.
At this point, with the whole report development team looking over your shoulder because they’ve never seen anything like Fiddler, it’s time to dig into the sessions and see what’s happening. In the web sessions window, let’s find the sequence of events that comprise the request for the URL to the server and what the server response may be. You may find it easier to view the data in Fiddler if you select the “Stacked Layout” option from the View menu.
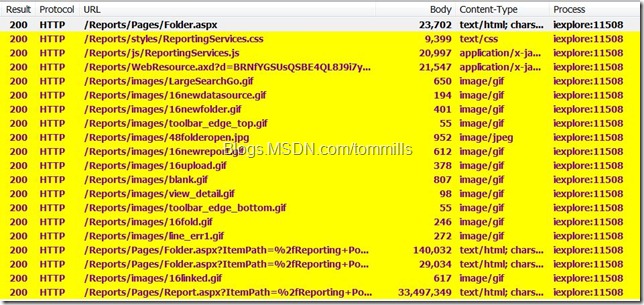
Here’s a screen capture from Fiddler of an example session capture with some fields omitted for clarity.
These sessions show the browser opening the Report Manager and then locating the report and clicking on it’s URL. Since we’re troubleshooting a time lag opening a report, we want to pay close attention to what the server is sending down the wire. If we scan the Body column, we see fairly small amounts of data until we reach the last entry. the last request shows over 33mb of text/html data send from the server. That’s a big chunk of data for a browser to process. If we select these sessions and click on the Timeline tab, Fiddler displays a timeline of the session activity.
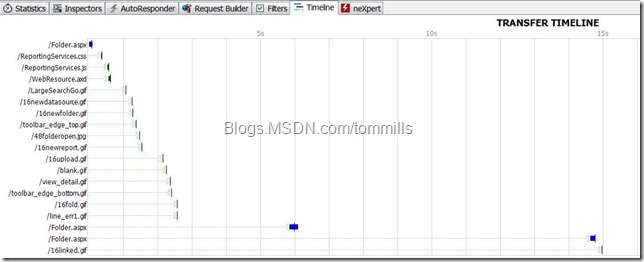
Since we think the last session entry might be the cause of our problem, we display the timeline without selecting it. The timeline indicates that these operations took less than 15 seconds total to be sent successfully to the browser.
 Here is the timeline with the last entry included (but truncated for clarity). It’s obvious that last glob of data is taking a long time to be delivered and rendered by the browser. But what is it? Why is the server sending that much data to the browser just to display a report and its parameters?
Using the Web View under the Inspectors tab gives us the answer. When we display the HTML, we see a rough rendering of the report. Our first realization is that the SSRS server had to send 33mb of data to the client just to display the initial report page. This can’t be good but we still don’t know what’s the root cause of the problem may be. To find out what’s in the HTML data, we use another inspector in Fiddler, the RAW view. Note that the default is to truncate the data at 150,000 characters. You can right-click the window and turn off the AutoTruncate feature. This will allow you to inspect all the HTML data. The first thing you will see is a large (in this case about 5mb) block of ViewState data. Since we can’t control this, we need to dig deeper. As we look further into the display we start to find a large number of HTML data that looks like this:
 Examining the HTML, we see it is used to display checkboxes. Since we don’t have that many visible textboxes on the report page, they must be hidden or lurking in another report object. This particular report has a number of parameter dropdown lists. Could these be the root cause of the problem? Quite possibly. To reach this conclusion, you must understand what a browser must do to display what appears to be a simple object like a dropdown list. Dropdown lists are filled with values that can be selected. The values along with any HTML or Javascript required to format the list. In the screen capture above, you can see that there is a large ratio of data that wraps each value in the list. The question now is does this particular report have a problem with the amount of data in the dropdown lists. We know that there’s a large amount of data involved in this report. If we look at the live report, we can see there are a LOT of values in each dropdown. Earlier, we checked the queries to see how they performed. But what we didn’t pay attention to is how many rows of data were being returned. At this point, it’s pretty safe to assume that this is our problem. To confirm, we deploy another version of this report with the dropdown lists populated with only one value each. When we click on the report URL, it displays quickly.
So we’ve found the problem, how do we fix it? A detailed description is out of scope for this article, but here’s a couple of methods to minimize issues like this. One is to limit the total number of values displayed in dropdowns and other objects. Drilldowns and sub-reports are other techniques that can alleviate these issues.
Hopefully, this should give you some insight into troubleshooting Reporting Services at the client tier.
Fiddler is freeware and can debug traffic from virtually any application, including Internet Explorer, Mozilla Firefox, Opera, and thousands more. You can download Fiddler here.


