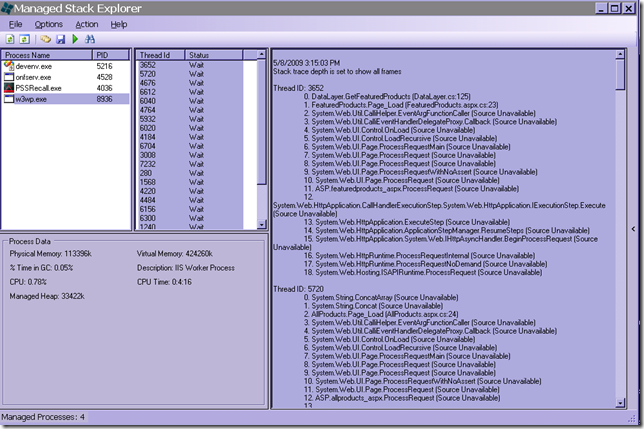
Neat .NET 2.0 StackViewer to troubleshoot hangs/performance issues
Bret wrote a post about Managed Stack Explorer, a really nice tool that was developed in 2006 but since then seems to have been forgotten.
It’s excellent if you want to troubleshoot hangs/performance issues in a process but don’t want to go through the hassle of getting and analyzing a dump. What it will do is basically attach, snap the .net call stack and detach so you can see what all the .net threads are doing without using a debugger.
What is even cooler is that you can copy/run the tool from anywhere which means that you can copy it to a clients machine if you have a runaway thread in a win forms app for example.
Have a nice weekend,
Tess
Comments
Anonymous
May 08, 2009
PingBack from http://microsoft-sharepoint.simplynetdev.com/neat-net-20-stackviewer-to-troubleshoot-hangsperformance-issues/Anonymous
May 08, 2009
Thank you for submitting this cool story - Trackback from DotNetShoutoutAnonymous
May 08, 2009
Bret wrote a post about Managed Stack Explorer , a really nice tool that was developed in 2006 but sinceAnonymous
May 08, 2009
Hi , Its really a nice post. Lot of times we had performance issues and tried using diagnostic tools. But this seems to ease our work Thanks, ThaniAnonymous
May 10, 2009
It seems it does not work with 64bit .net application. :|Anonymous
May 14, 2009
SharePoint Create your own customized usage report solution step by step SharePoint WebPart PropertyAnonymous
May 18, 2009
Thanks for the tip. A related question I've failed to find an answer for over the years: How in .NET (i.e. a managed app) can the amount of used Stack memory space be measured? Back in the good ol' 16-bit days there was a cool tool called Heap Peep which showed the stack and heap space usage. I got bit big time a few years back when we moved to IIS 6 and - surprise! - the available stack space was 1/4 of what was available in IIS 5, 256MB instead of 1GB for normal processes. I have some recursive routines for which I'd like to measure the stack space used. Thanks for all your great posts. GregAnonymous
May 18, 2009
Hi Greg, Have a look at this post http://blogs.msdn.com/tom/archive/2008/03/31/stack-sizes-in-iis-affects-asp-net.aspxAnonymous
May 19, 2009
Thanks for the tip Tess. Most of what was discussed in that post and subsequent comments I've figured out since we had the issue - except for modifying the W3WP.EXE, which I cannot do in my customers' production environments. But do you know HOW I can measure my actual stack consumption in managed code - via code or some tool? We have all these great tools for heap measurement, there's got to be something to measure stack usage. Thanks again. GregAnonymous
May 19, 2009
I'm not sure that there is a way at runtime. If you get a dump at the right time you can look at it in windbg !teb on the current thread will give you the thread environment block where you can find the StackBase for the current thread (in this case 70000) 0:000> !teb TEB at 7ffdf000 ExceptionList: 0006fc6c StackBase: 00070000 StackLimit: 00065000 SubSystemTib: 00000000 FiberData: 00001e00 ArbitraryUserPointer: 00000000 Self: 7ffdf000 EnvironmentPointer: 00000000 ClientId: 0000263c . 0000249c RpcHandle: 00000000 Tls Storage: 00000000 PEB Address: 7ffd5000 LastErrorValue: 0 LastStatusValue: 103 Count Owned Locks: 0 HardErrorMode: 0 r will give you the registers where you can find the esp (extended stack pointer) telling you where you are now 0:000> r eax=00000000 ebx=00000000 ecx=000004d2 edx=00001f68 esi=000001b8 edi=00000000 eip=7c8285ec esp=0006fc0c ebp=0006fc7c iopl=0 nv up ei pl zr na pe nc cs=001b ss=0023 ds=0023 es=0023 fs=003b gs=0000 efl=00000246 ntdll!KiFastSystemCallRet: 7c8285ec c3 ret and taking base-esp gives you the number of bytes you are using for the stack 0:000> ?00070000-0006fc0c Evaluate expression: 1012 = 000003f4Anonymous
May 19, 2009
Thanks for the WinDbg technique. I can do that :).Anonymous
May 27, 2009
Looks nice, but does not work on Vista Home Premium, I get some kind of install problem.Anonymous
August 29, 2010
you can find here a 64bits version mse.codeplex.com/.../AttachmentDownload.ashx
