How To: Use VSTS code profiler
Syed Aslam Basha here from the Information Security Tools team.
This blog post is in continuation with website performance testing simplified blog post. The final step in performance testing is to narrow down the faulty code which is taking lot of time or memory or CPU usage. I will show how VSTS code profiler can be used to narrow down the faulty code in a website.
Steps to configure VSTS Code Profiler:
- Launch VSTS and open the website.
- Run through all scenarios in the website and make sure there aren’t any errors or blockages.
- Click on Analyze menu and select launch performance wizard.
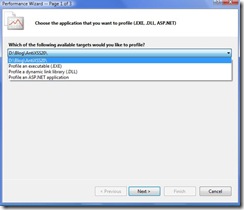
- It launches a wizard as shown below. It can profile current project or exe or dll or a website. Select the first one and click on next.
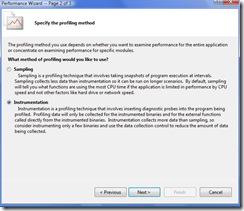
- Select the method of profiling say instrumentation and click on next.
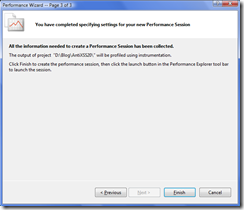
- Click on finish button
- Save the session
- Performance explorer is launched
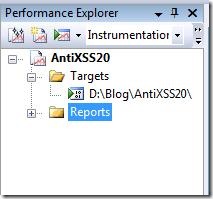
- Select launch with profiling as shown below
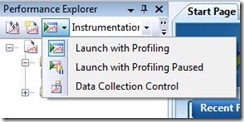
- Execute all scenarios in the application
- Click on stop button
- Report is generated and is shown in the report section of performance explorer
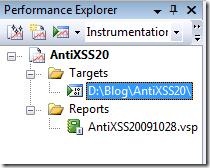
- Select the report, performance report summary is shown
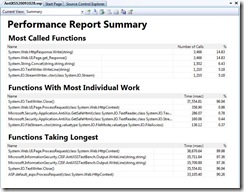
- The report clearly shows which functions are most called, functions taking longest..,
- You can save the performance session and reports
- You can change the current view and analyze the data to identify the faulty code
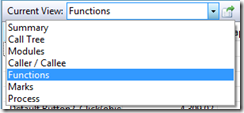
-Syed Aslam Basha ( syedab@microsoft.com )
Microsoft Information Security Tools (IST) Team
Test Lead
---------------------------------------------------------
Please leave a comment if the blog post has helped you.