Reporting in Team Foundation Server – Part 7: Excel Reports from Work Item Queries
In my last post in this series, I covered the new SQL RS reports we have in TFS 2010. Let’s look at a cool new feature for generating a report in Microsoft Excel based on a work item query.
- Walkthroughs for out-of-the-box experience including customizations
- SharePoint Dashboard
- Rich SQL Reporting Services Reports
- Excel Reports from Work Item Queries
- Custom report authoring tools and walkthroughs
- An overview of the reporting architecture
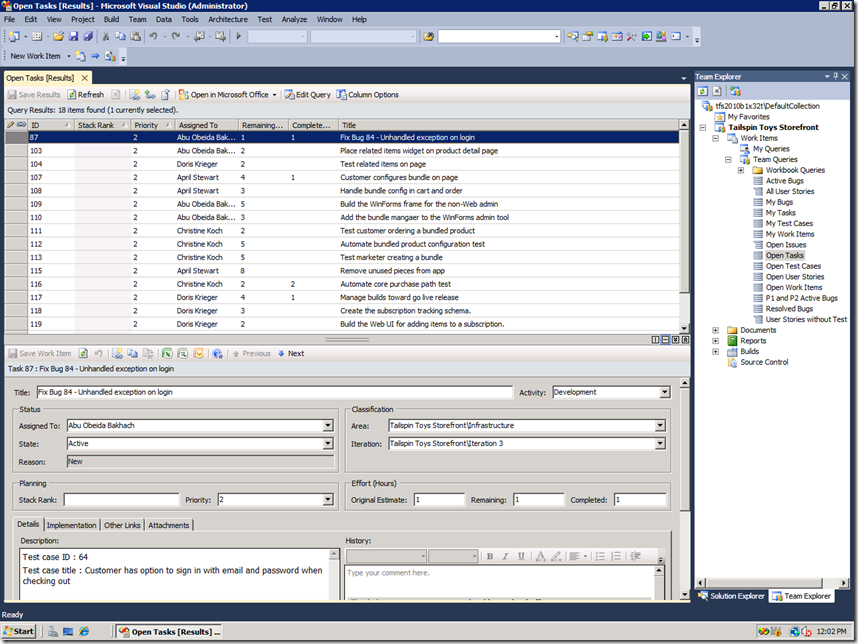
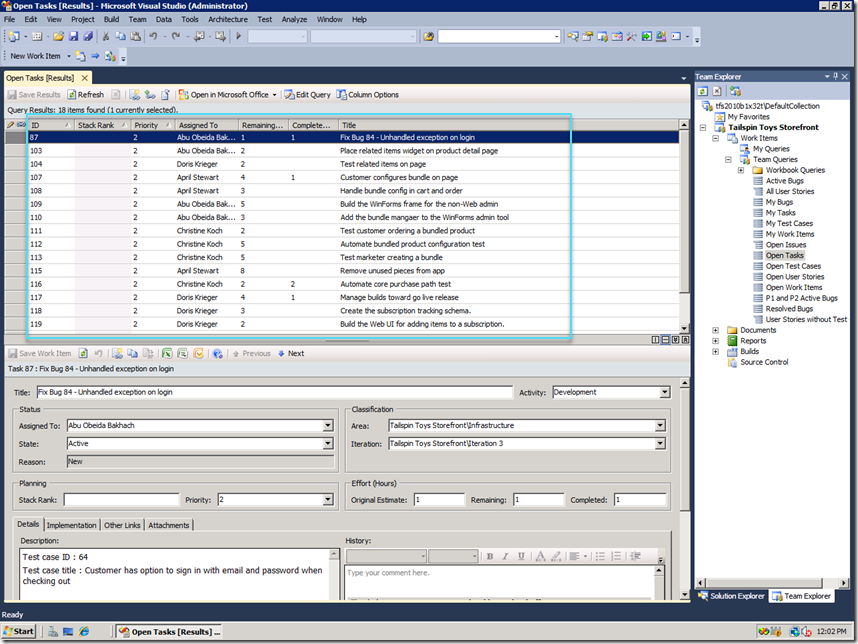
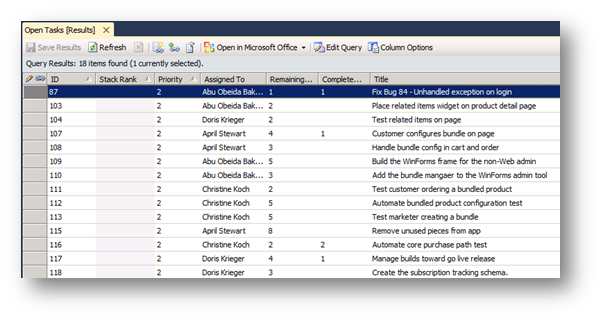
I know how to get this list of results using a work item query:
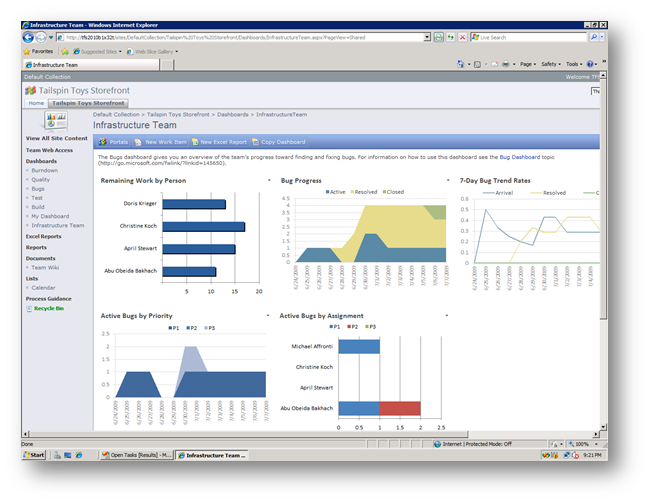
But, I want a chart like these without having to ask my developers:
Let’s look at how to get this done in TFS 2010:
Perfect – a cool report generated with just a few mouse clicks! Now, let’s backup and see how this works.
First, I ran a query to get Active Tasks in my project showing Assigned To, Remaining Work, Completed Work etc. in my query results:
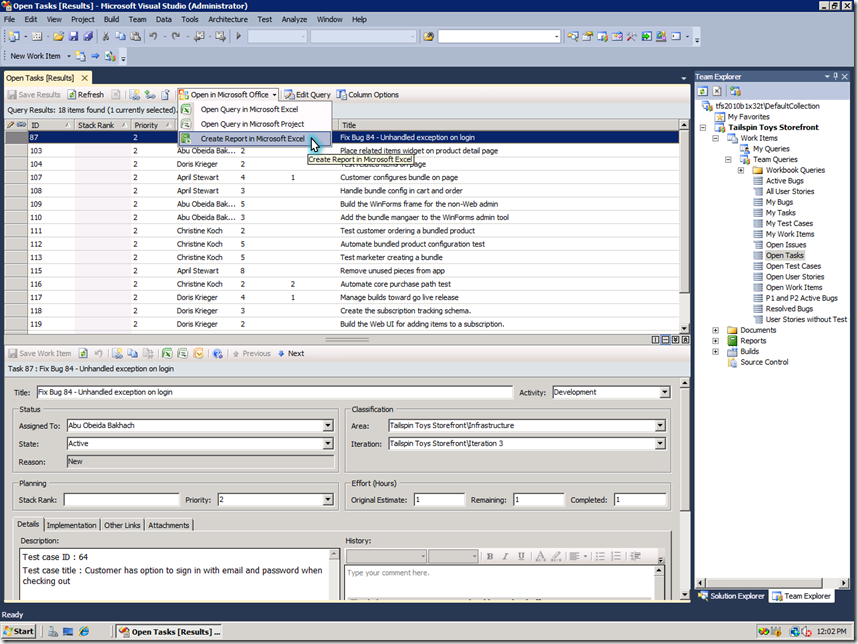
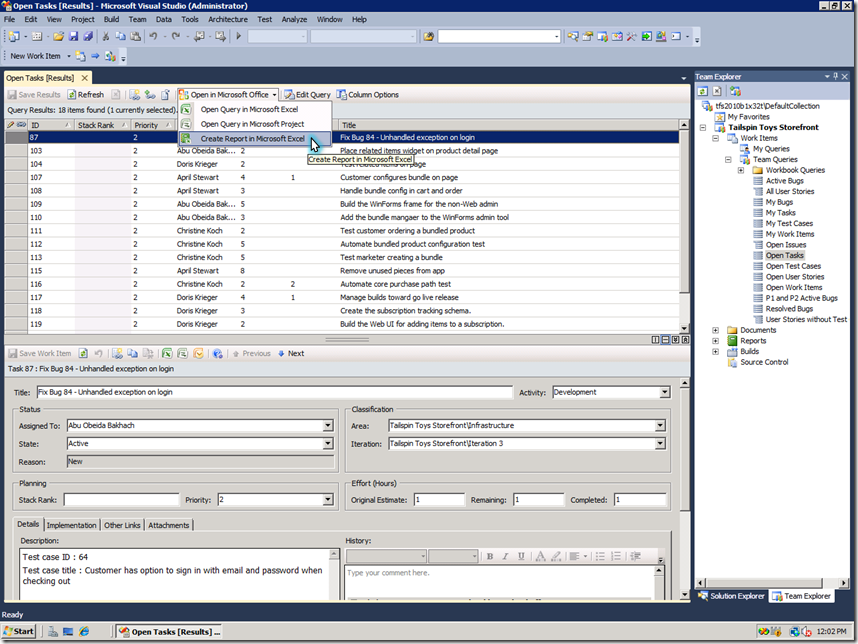
In the new menu bar that’s on the query results window, I have a new option to create a report in Excel:
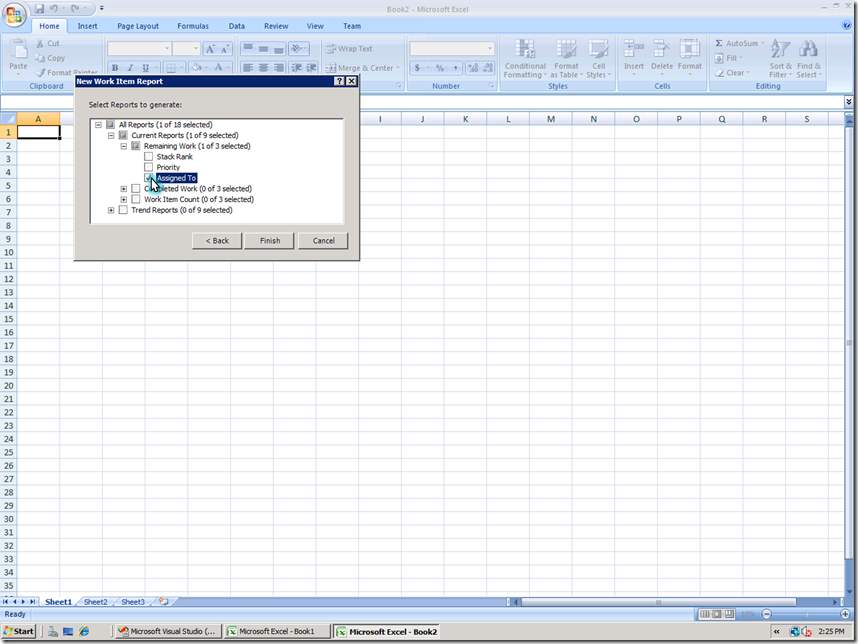
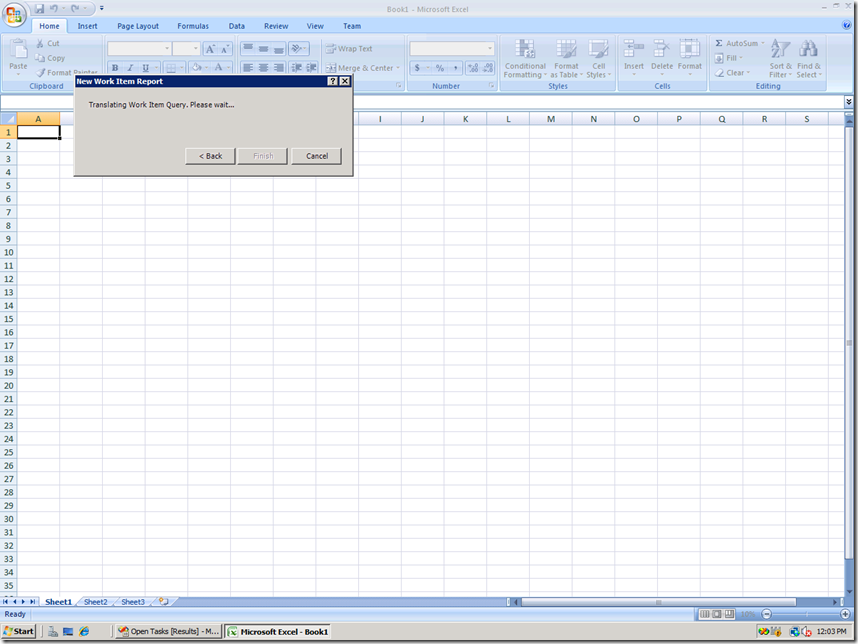
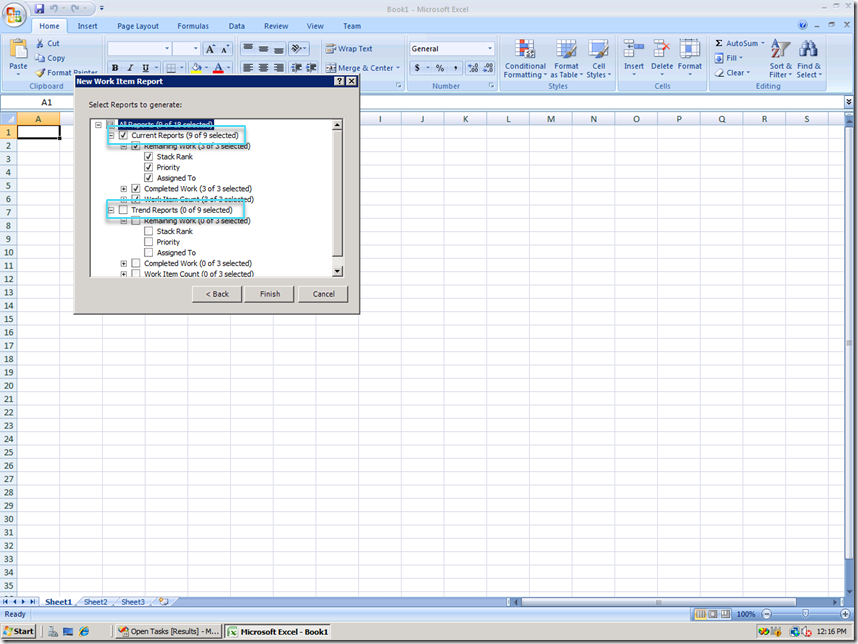
The work item query is translated to figure out the reports that can be generated and I get report options based on columns included in my work item query. I have the option to generate Current as well as Trend reports.
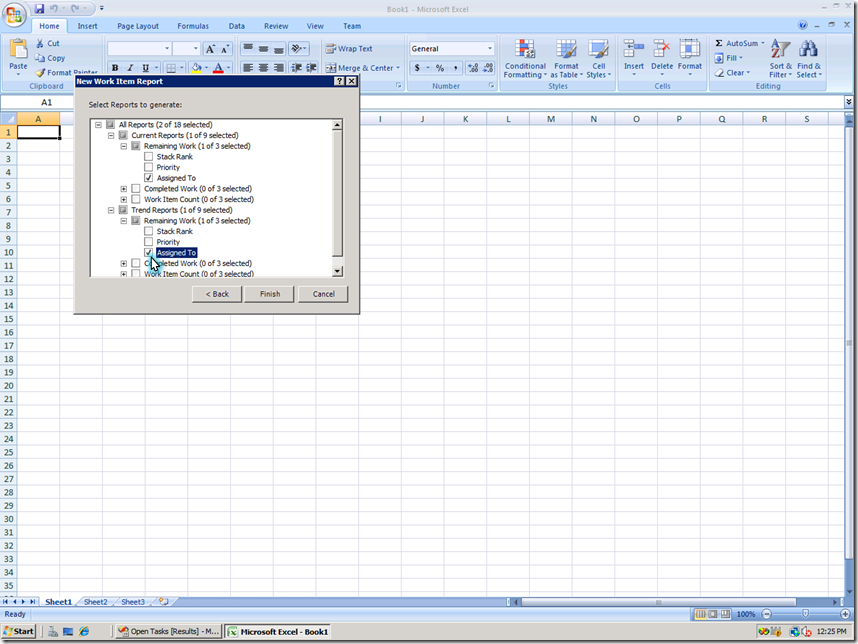
Let’s pick current and trend reports for remaining work by assignment:
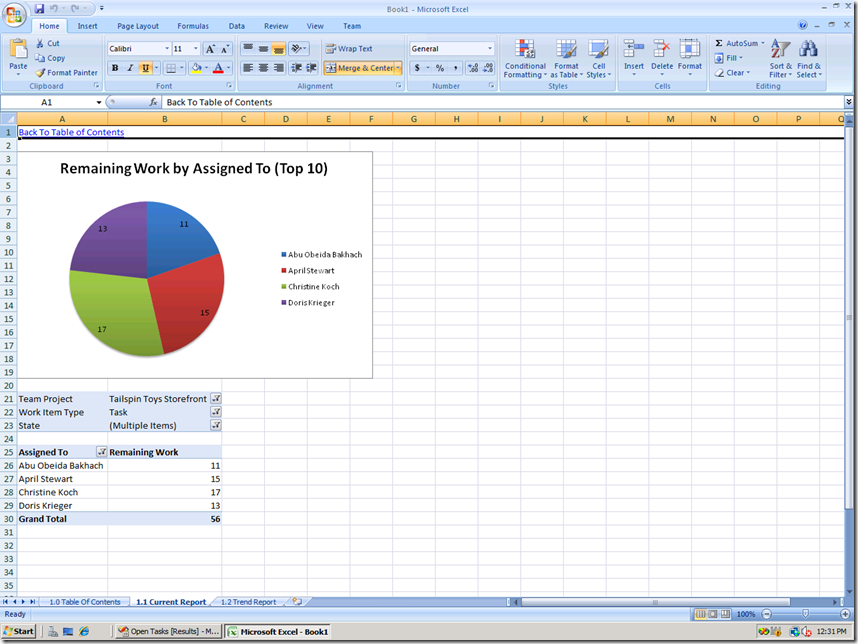
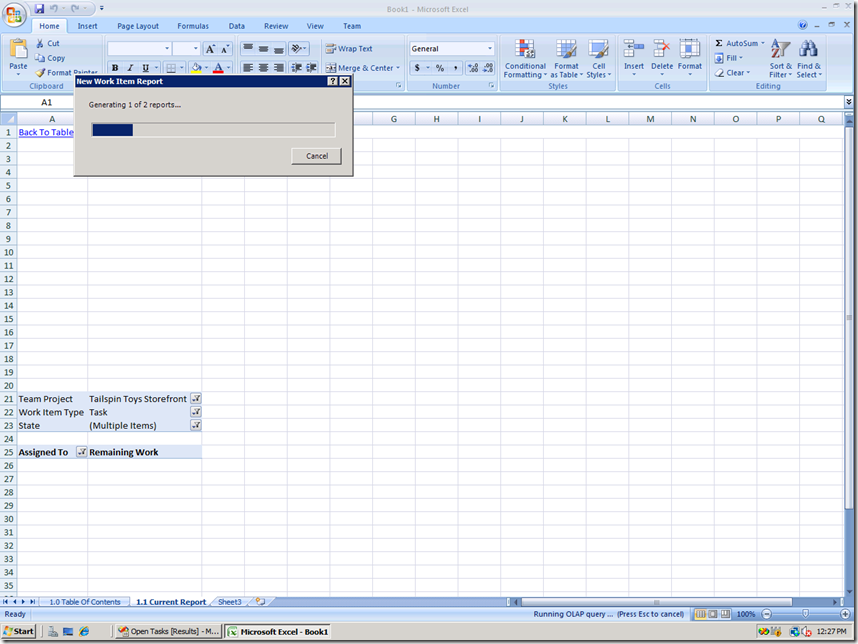
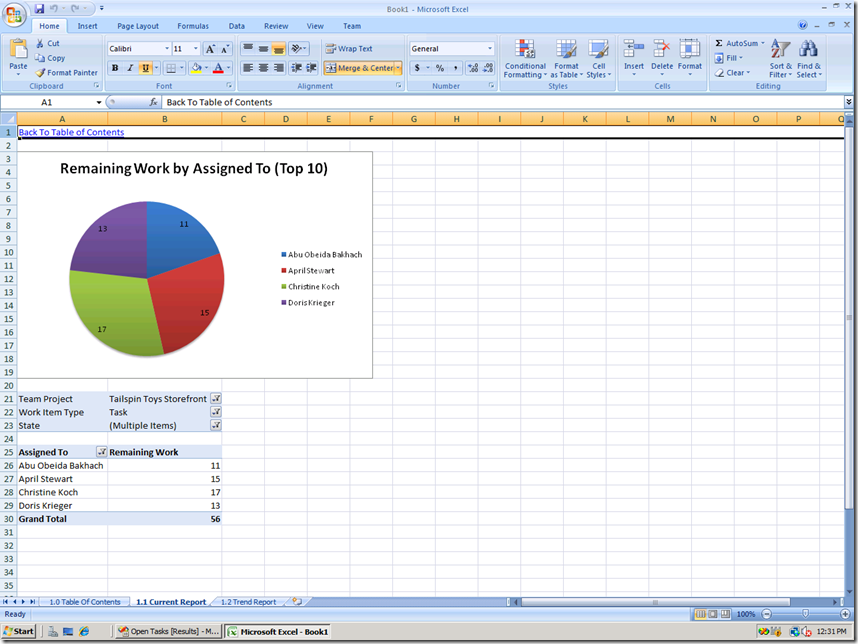
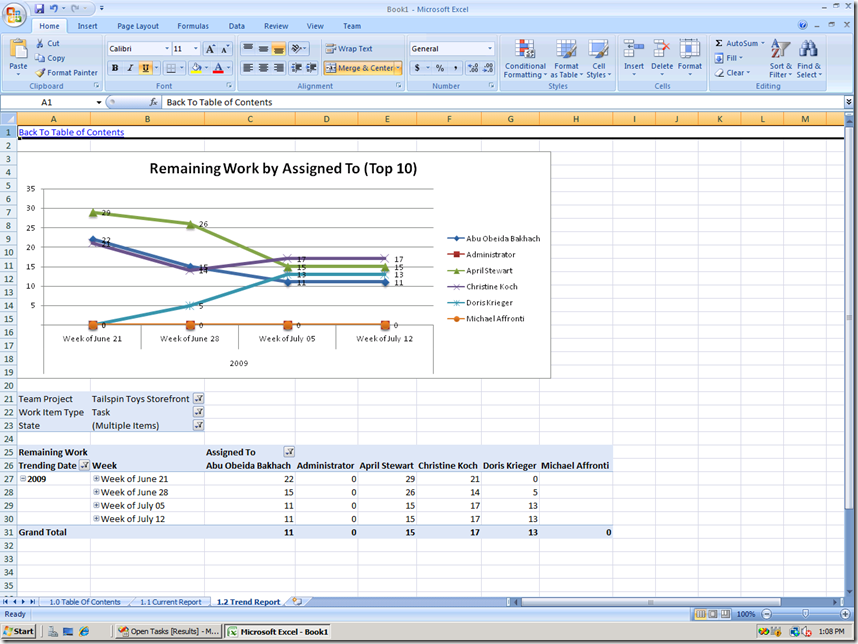
The selected reports are generated:
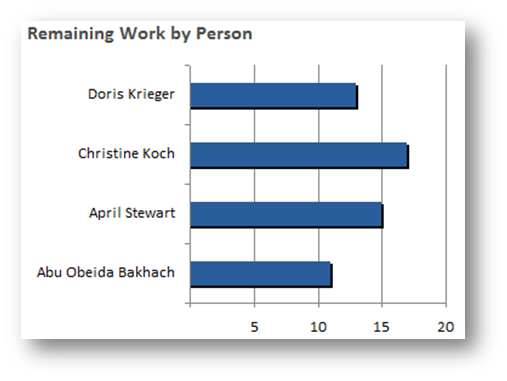
Current report:
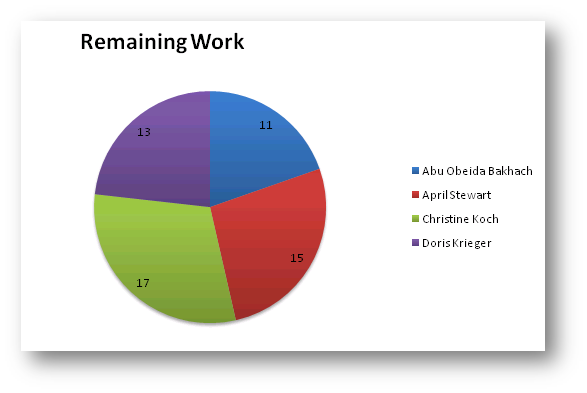
and Trend report:
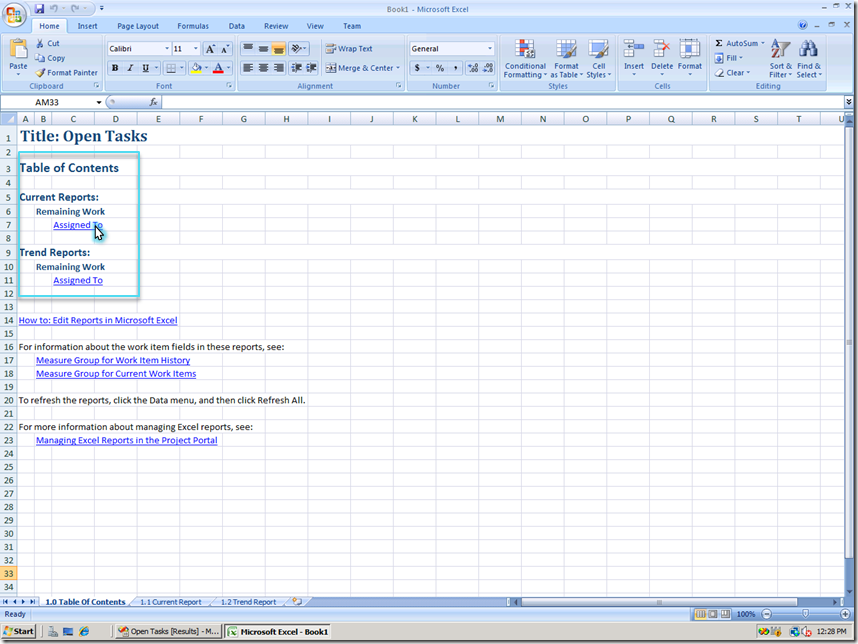
Now, that was super easy! The first worksheet generated includes a useful table of contents with links to reports:
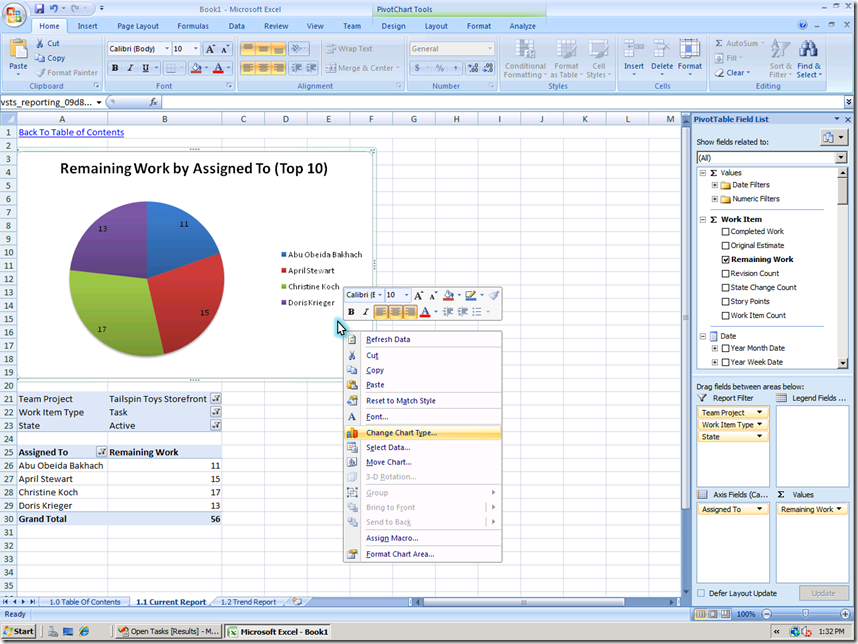
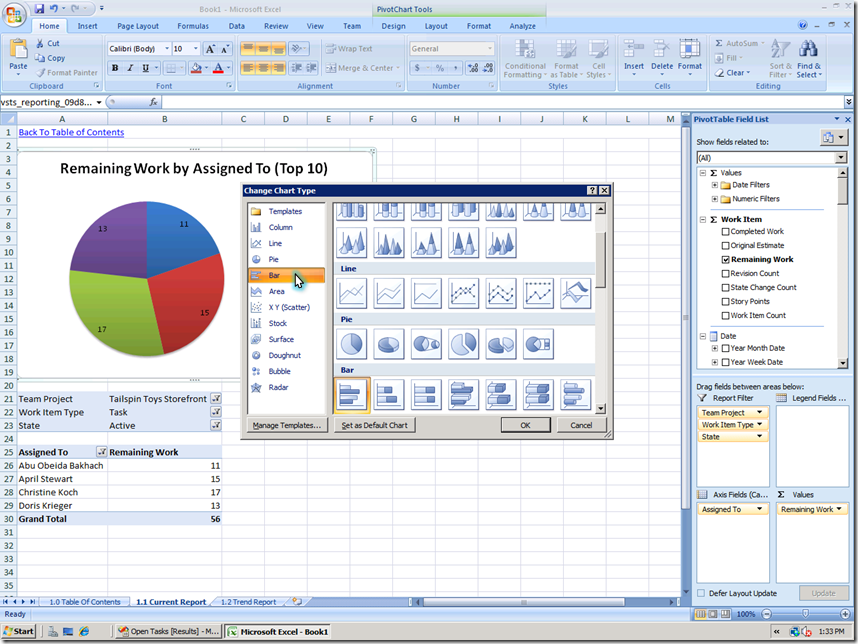
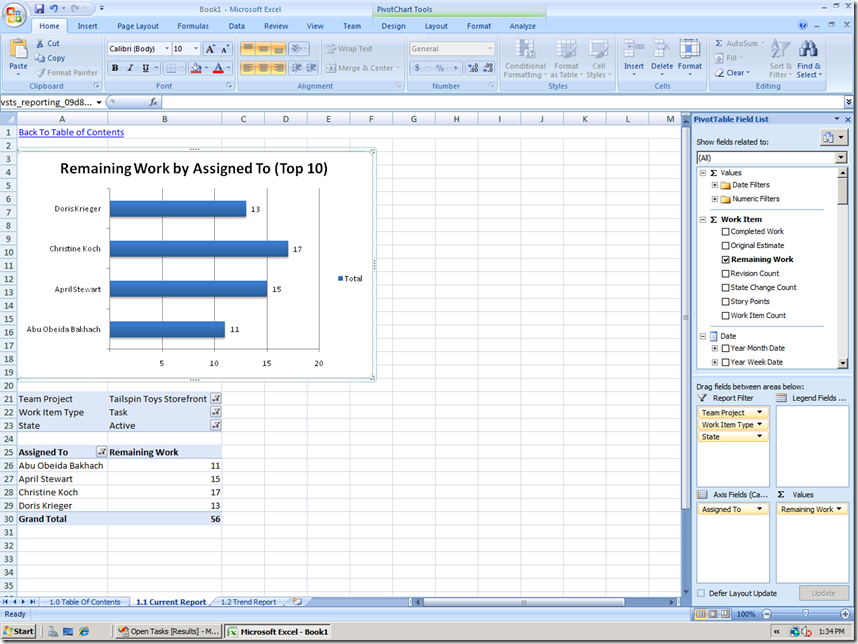
The reports that are generated are not static and can be modified so it is very powerful. Let’s say I want to make some simple adjustments to the current report so it’s a bar chart and also tweak some colors. I can just as easily tweak the Team Project filter to make it a cross project report or drag additional fields like Completed Work to show more information.
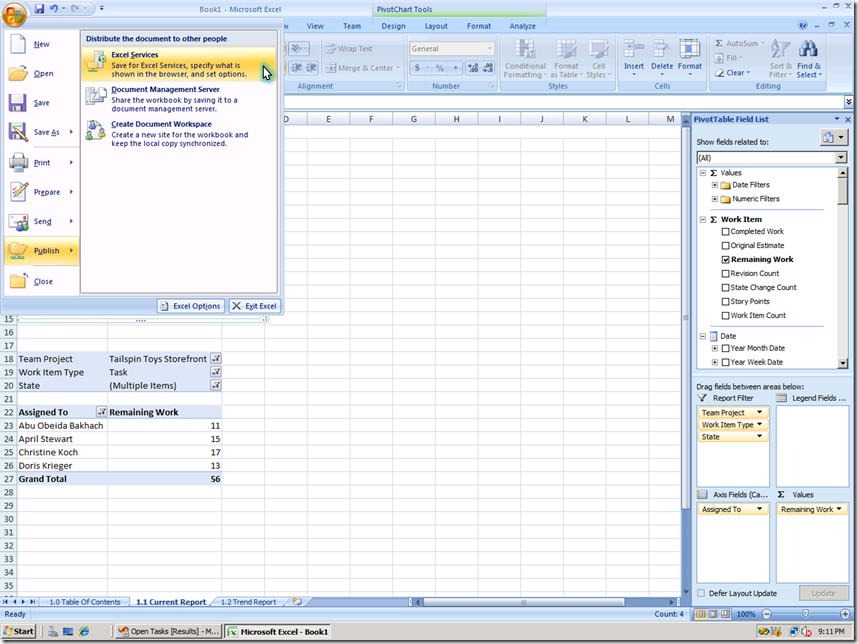
Similar to what we saw in my previous posts, I can easily publish this report to my team dashboard to share this with my team. I can use the Excel Services Options button to publish the entire workbook or specific charts. I’ll publish the customized report to the Excel Reports document library like the out-of-the-box Excel reports shown on the MOSS dashboard.
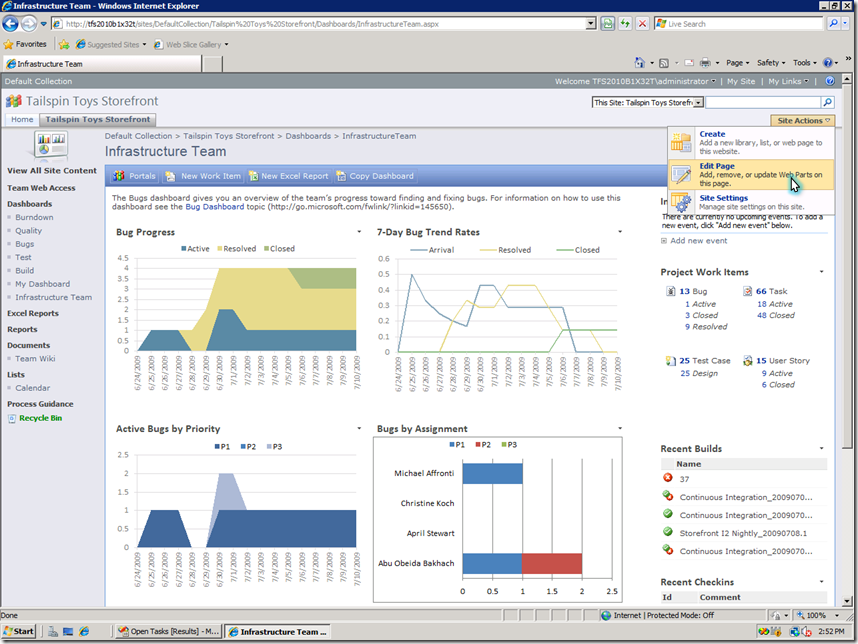
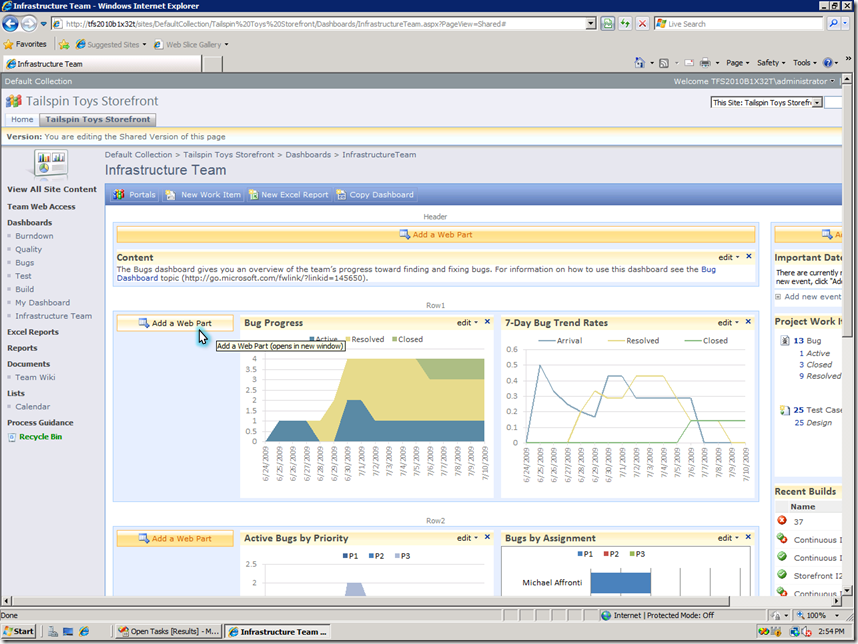
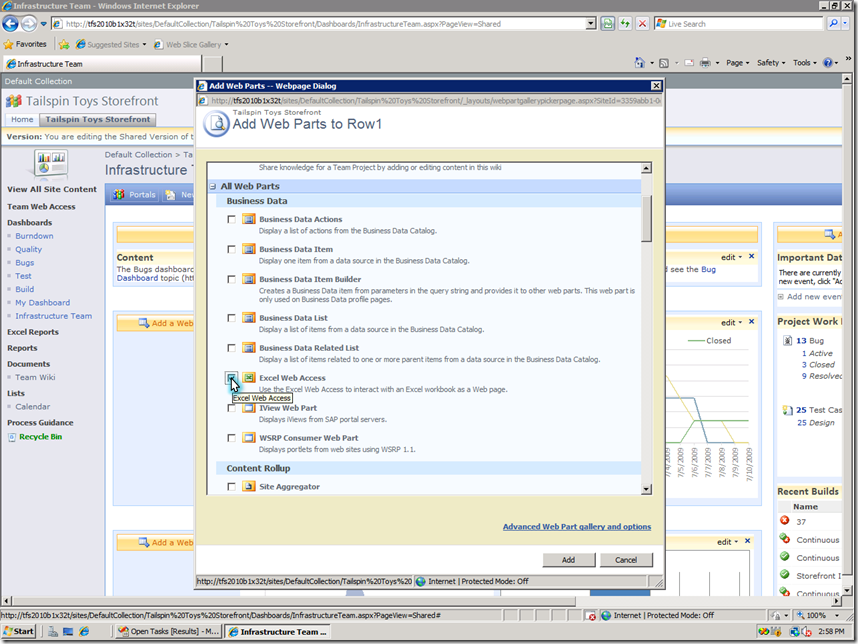
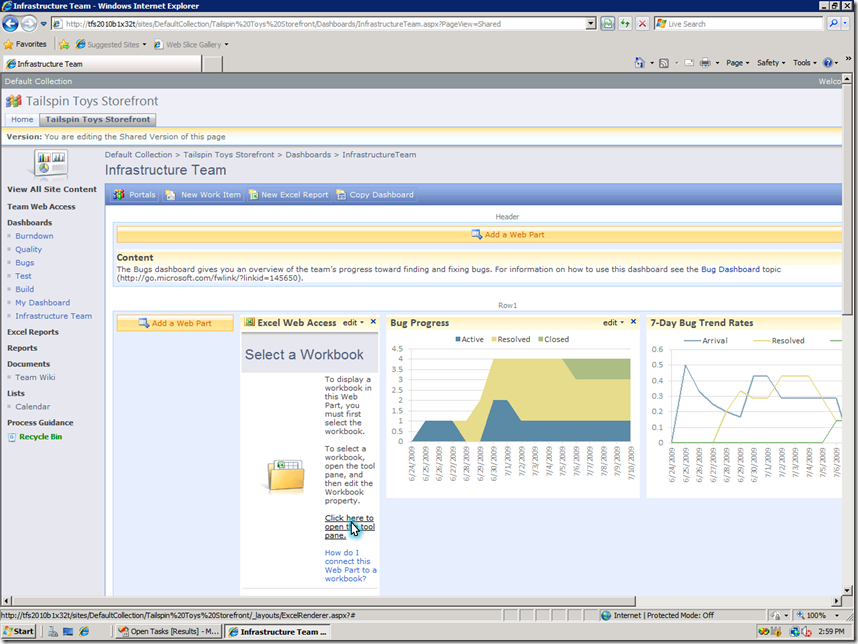
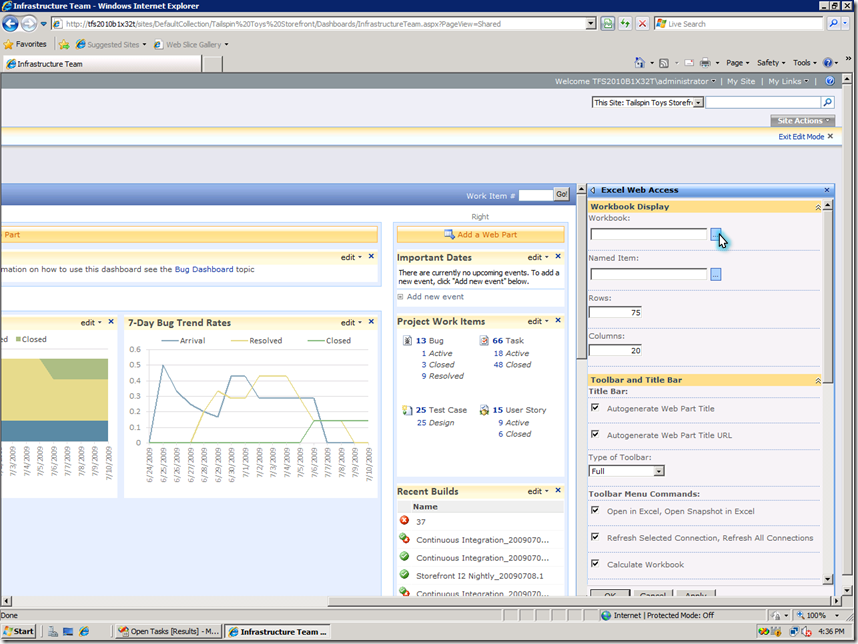
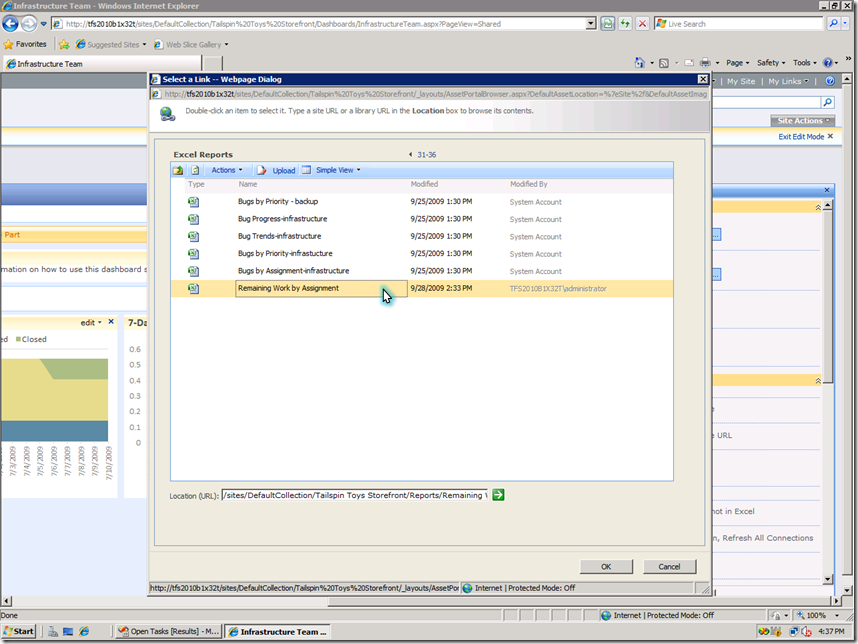
Then, I all have to do is use standard SharePoint functionality to edit my team dashboard, add an Excel Web Access web part to display the report from my newly published workbook:
So, it was easy to go from here…
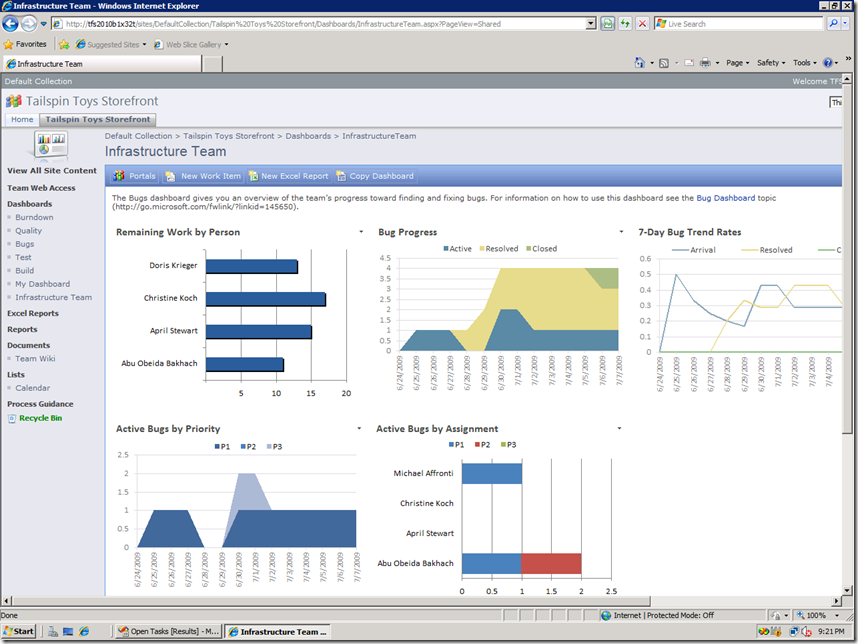
to here:
In the next topic I’ll cover custom reporting including walkthroughs for tools of choice. If you have questions or feedback please leave me a comment or send me an email at sunder.raman at microsoft.com
Comments
Anonymous
March 03, 2010
Great post Sunder, and absolutely a convincing argument for using TFS at companies that already use SharePoint. I think it would be hard to persuade a company that does not use SP yet to purchase it (and the CALs) just for TFS, but that's another discussion. I noticed, BTW, that most of these images don't show up while loading in IE8 and Chrome (the only browsers I use), but when I click on an image, I do get it. Maybe it would help if the article was divided into pages?Anonymous
March 04, 2010
The comment has been removedAnonymous
March 04, 2010
Hi Sunder, I really like the new reports. But, I don't see them in the process template editor. Can you reference me to some procedures for customizing the templates for these reports? This is needed so that the reports don't have to be customized for every team project that gets created. Thanks!Anonymous
March 04, 2010
Hi Bob, Unfortunately, Excel reports cannot be customized in the Process Template Editor yet. We are working on a whitepaper for customizing Excel reports in the templates and hope to publish this soon after RTM. I'll post a link to the paper on my blog once we have it ready. SunderAnonymous
March 05, 2010
Hi Sunder, this is great stuff! Please keep it coming. I'm working on a project this year to roll this functionality out to all our TFS users. Info like this really help with both my understanding but also being able to sell the value proposition to my managers. Thanks!Anonymous
March 05, 2010
It's great to hear the feedback. Thanks, Ross.Anonymous
March 16, 2010
Is there a way to show (from a Release perspective) a report showing overlap across multiple projects? Example: 4 separate agile projects vying for the same release date to production showing their status based on estimated complete vs remaining work?....in one report?Anonymous
March 26, 2010
The comment has been removedAnonymous
April 13, 2010
Hi Sunder, Thanks for the descreptive post. I tried to follow the instructions, but ran into a problem when an authorization dialog appeared during the process asking for User name and Password to Connect to Analysis Server. I tried verious credentials but with no success. Can you guide me through how to pass this dialog? Thanks!Anonymous
June 18, 2010
Hi Guy. I comepletely missed your comment as the notification didn't come in. You need to be part of the TfsWarehouseDataReader role on the Tfs_Analysis database for the connection to work. See msdn.microsoft.com/.../bb737953.aspx SunderAnonymous
February 05, 2012
Hi Sunder, How are you?? I' am creating my custom excel report, but to add in my project portal not find the option "Excel Web Access Web Part" I´am using TFS2010 and WSS3.0, how to add the feature Excel Web Access Web Part Thank YouAnonymous
February 15, 2012
Leandor, you will need to upgrad Sharepoint to the Enterprise editon of MOSS 2007 or SharePoint Server 2010 to get the Excel Web Access Web part. It is not available in your edition of SharePointAnonymous
March 13, 2012
Sunder, your information is very useful, thank you very much!Anonymous
July 13, 2012
The set of articles on reports has been incredibly helpful to me, thanks a lot!Anonymous
November 24, 2013
This informal is very useful to me. As I am quite new to TFS reporting, I am wondering if you can help me out making Variance report. I want to Display report as follows: Team Project, Title, Assigned To, Start Date, Finish Date, Variance (Start Date - Finish Date), I will appreciate if you can share BIDS reporting example for this as well. I tried using BIDS but struggling to get Formula for Variance. Appreciate your help on this.Anonymous
March 18, 2014
I am new to TFS 2010 Dashboards. I recently configured Project Portal and was trying to add Web Parts. Only few Web Parts has been listed. How do i install "Business Data" and "Content roll-up" and other kind of web parts in TFS. Where i should download these web parts ? Kindly help me on this. Thanks!Anonymous
September 17, 2014
Is it possible to automate this using API/VS/SSRS ? I want my teams to get these reports without me customizing manually for each team. Thanks

