Metrics in Azure Monitor (preview) released
We just released a first set of metrics for Azure Service Bus. From now on you can go into the portal and utilize the metrics section in your namespace to get an understanding how the namespace is performing.
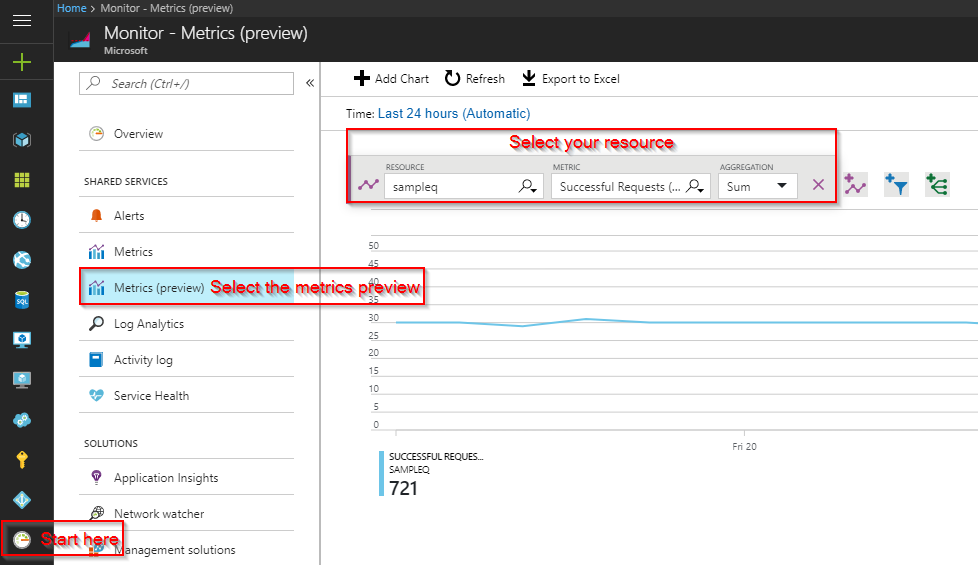
You can see metrics specific to the namespace you are in but also specific to an individual resource or via the "Monitor" feature which can be accessed via the left pane in the Azure-Portal. To access the metrics, click on "Metrics (preview)".

The Article describing the new feature can be found here. It is also possible to access these metrics via code.
- Please also see thisgreat blog post from Sean Feldmann.
- And this great blog post on how metrics can be used to auto scale from Tom Kerkhove.
What's coming next:
- We will add metrics to count the active messages in the entity.
- We will add metrics to understand the entity size.
- The entity specific metrics, which you can access via the service bus namespace will behave more like the metrics preview you can see above and allow you to select metrics specific to your selected resource.