RS Maps with Spatial Data and Bing Maps
SQL Server 2008 R2 August CTP includes map visualization functionality in Reporting Services, as briefly described yesterday. In this posting, I’m going to provide an introduction of how to use spatial data and Bing Maps with Reporting Services Maps.
The attachment of this posting includes the final report so you can try it out yourself in Report Builder 3.0. The data source for the report is the Person.Address table in the AdventureWorks2008 sample database (download) which includes a geospatial column.
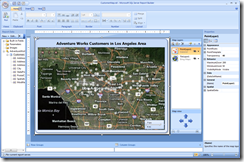
The report scenario is about showing the addresses of all your customers in the Los Angeles area. Accomplishing this requires just a few steps in Report Builder 3.0, and you don’t even need to write a single RDL expression! Btw, I will cover some of the new interesting spatial functions added to the RDL expression language in another posting.
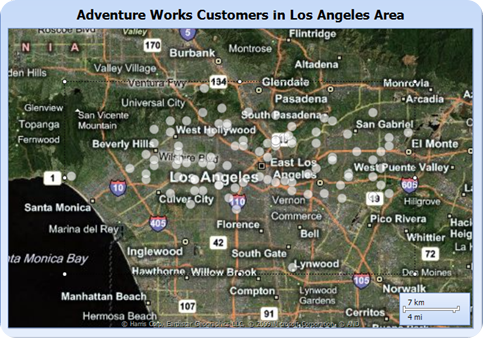
Let’s start with the screenshot of the final map visualization of this report:
Steps:
- Start Report Builder 3.0, and create a data source connection to the AdventureWorks2008 sample database (download).
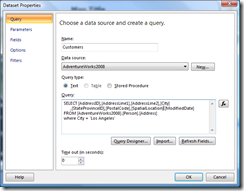
- Define a new dataset which includes geospatial data. For example:
SELECT [AddressID], [AddressLine1], [AddressLine2], [City],
[StateProvinceID], [PostalCode], [SpatialLocation]
FROM [AdventureWorks2008].[Person].[Address]
WHERE [City] = 'Los Angeles'
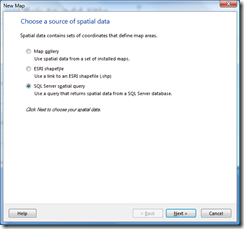
- From the Report Builder 3.0 toolbar, insert a new map, using the map wizard. On the first page of the wizard, select to use a SQL Server spatial query.
- On the second page of the wizard, select the dataset defined in step 2 (“Customers”).
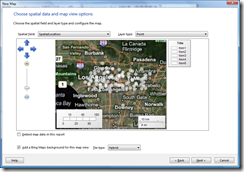
- When going to the third page of the wizard, you will notice that it automatically detected that the “SpatialLocation” column contains geospatial data and the wizard displays a cloud of points. Simply select “Add a Bing Maps background for this map view” and you will get to see a backdrop for the cloud of points of the Los Angeles area – this is because the map wizard analyzes the rows contained in the dataset and their geospatial location.
- Since our specific dataset doesn’t contain further information about the customers, we select a basic marker map as visualization. If we had further data in our dataset, such as total sales amount, we could do a bubble map taking into account revenue.
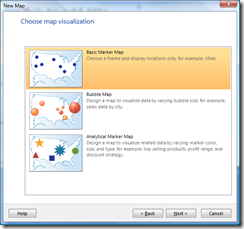
- In the final step of the map wizard we can chose to the marker type and display labels with each point. Note that all these settings can also be made / changed later through the map property dialogs, as well as the property grid in Report Builder. The map wizard is usually the quickest way to get started though.
- We should now have a map on the design surface. You can further tweak settings of each map layer and map properties as desired.
Of course, you can do a lot more with Map and the geospatial data integration in the RDL expression language – I’ll cover this in upcoming postings.
