Remote debug BizTalk pipeline component in Azure Virtual Machine
Last week in day 2 Build keynote, Mark Russinovich showed a demo of remote debugging in Azure Virtual Machines. It is a really cool demo. If you haven't watched it already, I suggest you go ahead and watch it – now.
Context
This feature has a lot of potential and will be a real productivity boost for developers. This blog post is a variation of the same demo in the context of BizTalk Server. It will cover remote debugging of a pipeline component that is deployed in a BizTalk Server running in Azure Virtual Machine.
Pre-requisites
Azure subscription
If you want to follow along with the contents of this blog post, you need a Microsoft Azure subscription. You can sign up for a free one-month trial here.
BizTalk environment setup
For the purposes of this blog post, it is assumed that you have a BizTalk Server environment setup in Azure Virtual Machines. To know more, you can refer to my previous blog post on getting started with BizTalk Server in Azure Virtual Machines.
BizTalk Server and Windows Azure SDK
In the development machine, install Azure SDK for .Net 2.3 and BizTalk Server 2013 SDK. BizTalk Server SDK can be installed from BizTalk Service media. If you don’t have easy access, you can always try installing SDK from BizTalk Server 2013 evaluation edition.
Recap: BizTalk Server environment is setup in Azure Virtual Machine and Visual Studio is running locally in my development machine.
Setup
Archive component
I wanted to debug a custom pipeline component. Instead of creating one myself, I wanted to re-use something that the BizTalk community had created. I landed upon a TechNet wiki that lists down the various custom pipeline components available. It is a great collection. Kudos to the TechNet wiki contributors for compiling the list, and to the BizTalk community for authoring and sharing these components.
I decided to make use of an archiving component. This component is created by Steef-Jan Wiggers, one of the product MVPs. The pipeline component does what the name suggests – archive the message to a file share.
BizTalk setup
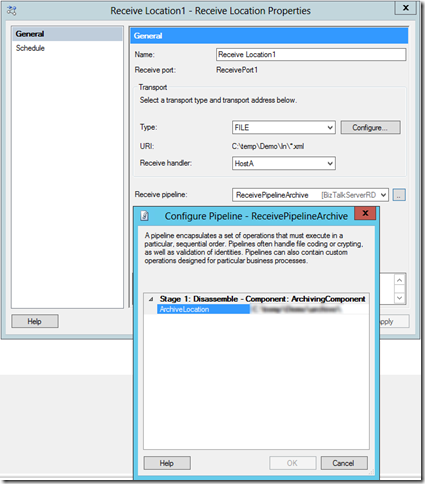
The BizTalk setup is a very straight forward one. It is a message in, message out scenario. In the receive pipeline, the archive component is used.
Enabling remote debugging
Enabling remote debugging in Azure Virtual Machines is very easy. In your Visual Studio’s Server Explorer, you can sign in to your subscription and list down the Virtual Machines.
In this case, my BizTalk environment is present in btsdevvm.
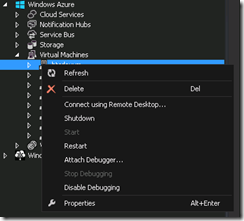
Enabling remote debugging is as simple as right clicking the VM, selecting “Enable debugging” and click OK.
Remote debugging
Once debugging is enabled on the VM, I can right click the VM and attach a debugger.
I can then view all the processes in the remote VM and attach to it!
Note that I can view the BizTalk host processes (BTSNTSvc) in the remote machine. I can select the host process to which I want to attach the debugger to, and start debugging.
And when a message is dropped to the location of the receive port in the remote BizTalk machine, you see the debugger hit in your developer machine!
You can now continue to debug as if you are debugging locally. I believe this feature would be extremely useful and productive to developers who want to debug and troubleshoot their applications remotely.
Hopefully, this gives an overview of leveraging the cool new “remote debug in Azure Virtual Machines” feature in the context of BizTalk Server. I have used pipeline component as an example.


