Which Profiling Mode Should I use?
Short Answer:
Profiling Mode |
When to use |
CPU Sampling |
Use this mode to identify methods that consume too much CPU. This mode has low overhead and is well suited for CPU bound applications. |
Instrumentation |
Use this mode to get exact call count and exact time for each method. This mode is well suited for application that make large amount of external kernel calls (e.g. I/O and Network). |
.NET Memory Allocation |
Use this mode to identify methods that allocate too much memory. |
Concurrency – Resource Contention |
Use this mode if you suspect your multi-threaded application is experiencing synchronization issues |
Concurrency – Concurrency Visualizer |
Use this mode to get a comprehensive view of how your application is utilizing parallelism |
Longer Answer:
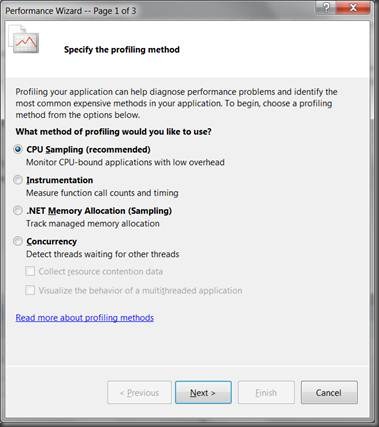
So you have an application that is not performing as you anticipated and you want to know what is going on. Naturally :) you go to Analyze menu and choose “Launch Performance Wizard…”. There comes the first page of the performance wizard asking you to decide on one of the four available profiling modes before letting you proceed to the next step:
But which one is the right one for your application? The following is a brief description of what you can expect from each mode of profiling to help you better decide which profiling mode to choose.
CPU Sampling
Sampling is a basic, yet powerful mode of profiling that can identify which method in your application are using too much CPU. Sampling has a very low overhead, but it is amazingly powerful in spotting performance issues. You can expect profiler to report a relative measure of how much work each method performed individually. You can also expect to see a relative measure of how much work each method caused other methods to perform.
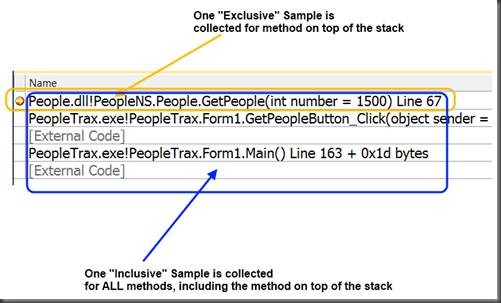
The way these relative measures are gathered is through “Inclusive” and “Exclusive” samples. Take a look at the following picture:
When you profile your application in Sampling mode, profiler will examine the execution call stack at pre-defined intervals and collect samples. For each method on top of the call stack, it collects one “Exclusive” sample. For all methods on the call stack (including the method on the top), the profiler collects one “inclusive” sample. Once you done profiling the application, the profiler will tally up all the sample counts for each method. The methods with the most number of “Exclusive” samples are doing a lot of individual work (since they have been on the top of the call stack a lot). Methods with the most number of “Inclusive” samples are causing a lot of work to be done (since they have other methods above them on the call stack).
Sample profiling mode is most suited for CPU bound applications, as it only collects samples when the application is using CPU. Therefore, you may not collect enough samples if your application often blocks on external kernel calls (e.g. blocks a lot on I/O or Network). That is where you would want to use Instrumentation profiling.
Instrumentation
Instrumentation mode will provide you with exact call counts and exact time your application spent executing each method, including the time a method was blocked on external kernel calls. In order for profiler to collect exact call counts and exact execution time for each method, it needs to insert probes into your code (e.g. Instrument your code).
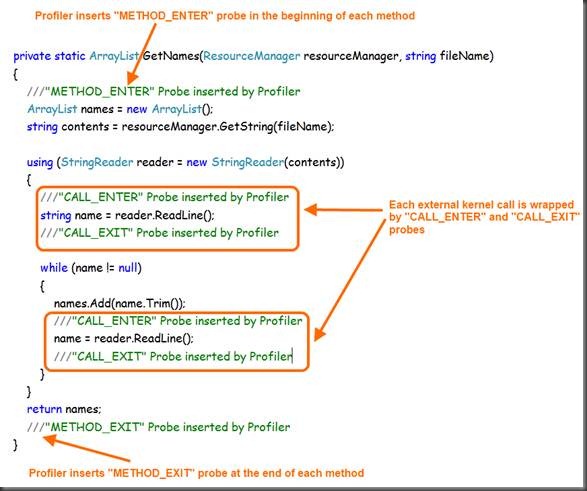
Here is how probe insertion works:
Using these inserted probes, profiler computes “Elapsed Time” and “Application Time” for each method. Elapsed time is the time spent inside a method, whether that method is executing instructions or is blocked on external calls. Application time, on the other hand, is the amount of time a method spent doing individual work and was not blocked.
During the instrumentation process, each method is enclosed by a set of “METHOD_ENTER” and “METHOD_EXIT” probes. Then, each call that leaves the current assembly is wrapped by a set of “CALL_ENTER” and “CALL_EXIT” probes. Profiler will then counts the number of “METHOD_ENTER” and “METHOD_EXIT” probe hits to identify the exact call counts for each method. Profiler will then use the time spent between the probes to calculate Application and Elapsed time (I am skipping over a lot of details here that deserves its own post).
So far, we have only been concerned with “Time” as a measure of performance. Obviously, time is not the only resource an application uses. Memory is another one. Profiler can help you identify how much memory your managed application is using. That brings us to the third profiling mode.
.NET Memory Allocation (Sampling)
.NET Memory Allocation mode uses the same approach as Sample Profiling mode, but instead of collecting samples at pre-defined intervals, profiler collects samples anytime an object is allocated. When an object is allocated, profiler will capture the type and size of the objects allocated. You can expect profiler to identify the methods that have allocated most amount of memory, as well as types with the most amount of memory and most amount of instances during the profiling session.
In addition to collecting object allocation data, profiler can also capture object lifetime information. More on object lifetime will follow below in the “Switching between different modes” section.
Concurrency
In Multithreaded applications, synchronization objects are used to control the “rhythm” of the application. However, how these synchronization objects are used and how the threads are organized and executed can vastly impact how your application performs. Concurrency profiling will provide you the information you need to analyze how well your application is utilizing synchronization objects and how well your application is taking advantage of parallelism.
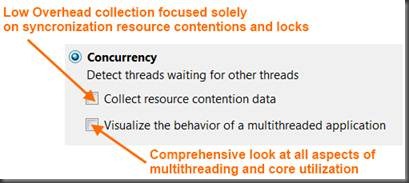
When selecting concurrency mode, you must decide on at least one of the two collection methods:
The first option is Resource Contention mode. Resource contention mode is a low overhead method of concurrency profiling which (similar to CPU Sampling and .NET Memory Allocation Sampling) collect inclusive and exclusive samples of methods on the stack anytime a thread blocks on a locked synchronization object. When selecting Resource Contention profiling, you can expect profiler to report the list of most contented synchronization resources as well as the threads which had the most number of resource contentions.
The second option, concurrency visualizer, is a comprehensive view of how well an application is using parallelism. When selecting concurrency visualizer, you can expect profiler to report on the activities of threads during the profiling session as well as how well CPU and each core on the CPU was utilized. I encourage you to check out the concurrency visualizer blog.
Switching between different modes
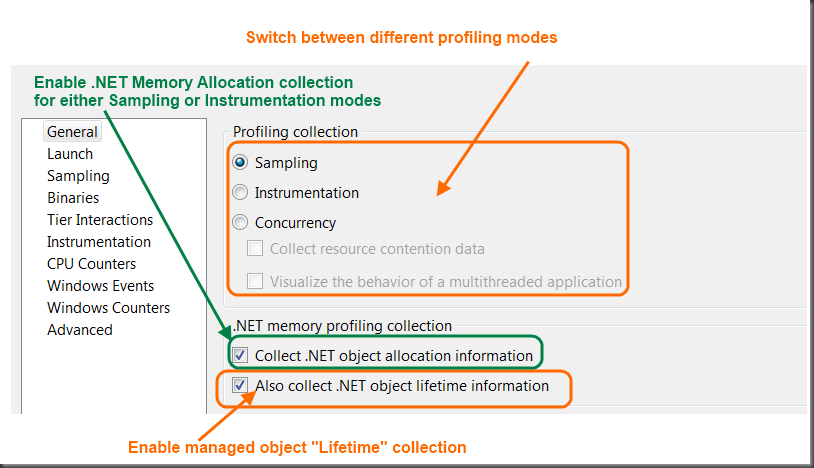
Up to this point, we have focused on the first page of the Performance Wizard. Performance wizard walks you through the steps necessary to create a performance session. You can, however, change the profiling mode after a session is created. Profiling mode is found on the “General” tab of performance session properties:
It is via the General tab that you can enable .NET Object Lifetime collection or add .NET Memory Allocation and .NET Object Lifetime collection to instrumentation mode.
