Multi-Tier Performance Analysis
Think of a typical three-tier application; the one that has, let’s say, an ASP.NET UI, a business logic layer, and a data access layer which talks to a SQL Server instance. Ever wondered which queries are executed as a result of serving a page? Ever wondered how long it takes to execute those queries? Ever wondered which one of those queries is the one taking the most time and slowing down your application?
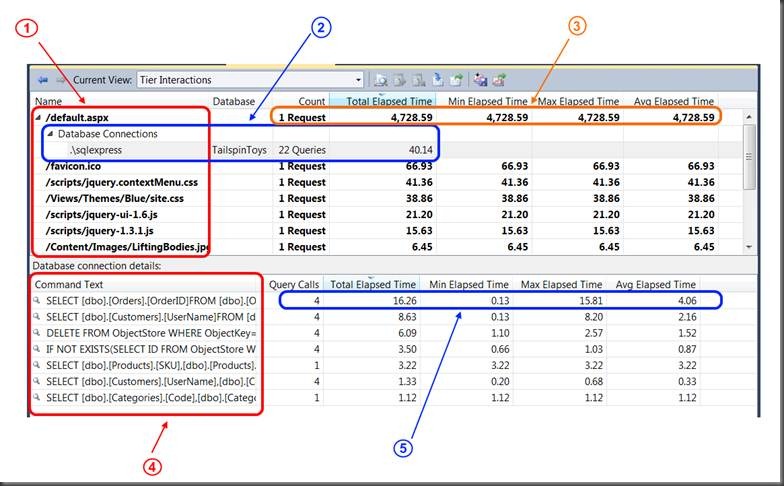
Let me introduce you to Tier Interaction Profiling, the first Multi-Tier Performance Analysis feature in Visual Studio. Tier Interaction Profiling enables you to measure the performance of your application from a database interactions point of view. Let’s take a look at a screenshot:
Figure 1 - Tier Interaction Profiling Report
Tier Interaction Profiling (TIP) report follows a master-detail approach. Sections 1, 2, and 3 are in the master section, while sections 4 and 5 are in the details sections. These sections are:
1. This section looks a little different depending on whether your application is an ASP.NET application or a Windows application. If you are profiling a windows application, you will see the name of the EXE. On the other hand, if your application is an ASP.NET application, TIP will show you each page (and other artifacts like JPG or CSS content) requested during your profiling session.
2. If any web page (or Windows application if you are profiling a Windows application) makes use of a database connection (either directly or through an intermediary layer), TIP will display information about that connection. TIP groups the data about connections by connection string. For each connection, TIP will also show you the sum of the queries executed during the requests made to the web page (or Windows application) along with its total execution time. Once you select a connection, TIP will show you details about queries executed via that connection (see sections 4 and 5 below).
3. For each web page, TIP will show the number of times the page was request along with Total, Minimum, Maximum, and Average time spent on processing the request s.
4. For each connection selected in the master section, TIP will show the queries executed. As the connections (in section 2) are grouped by web page request (or Windows application run), you are in effect looking at the queries executed as a result of making that web page request. TIP shows you the actual command text of the query. If you are using stored procedures, TIP will report the stored procedure name. If you are using LINQ, TIP will show the SQL generated for the LINQ query.
5. For each query, TIP displays the number of times the query was executed along with Total, Minimum, maximum, and average time spent executing that query. Similar to section 4 and as the connections are grouped by web page request (or Windows application run), you are in effect looking at performance information for a given query (or stored procedure) as a result of execution of a web page.
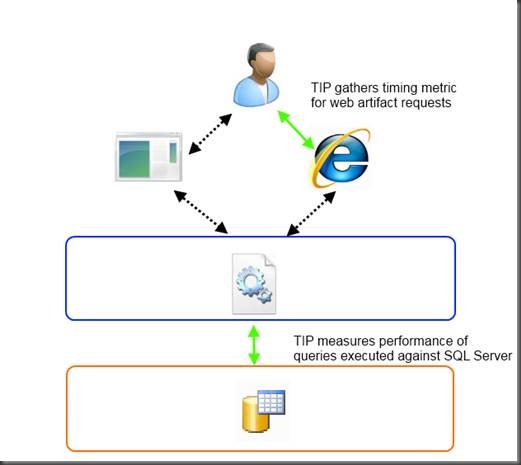
Figure 2 below is a depiction of a typical 3-tier application. The green arrows indicate where TIP interjects itself to collect performance data points; the black arrows indicate places which TIP excludes from its performance data point collection:
Figure 2 - TIP Data Point Collection Areas
Where do I find Tier Interaction Profiling
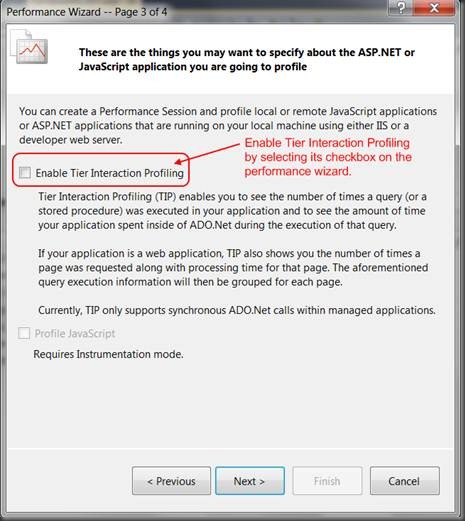
There are two ways in which you enable TIP for your profiling session. First, when creating a performance session for a web application through the performance wizard, you can enable TIP by selecting it as an option for your performance session:
Figure 3 - Enabling TIP on Performance Wizard
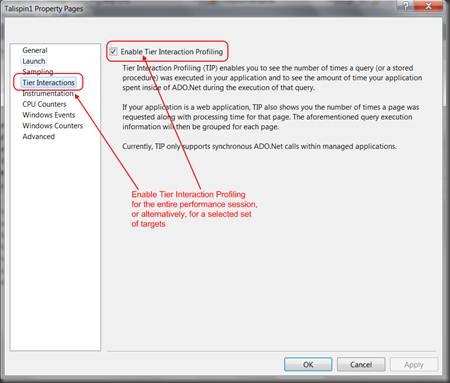
The other way is to enable TIP for the entire performance session or any of the performance session targets. You will find the Tier Interaction Profiling session option in the session or target properties:
Figure 4 - Enabling TIP on Performance Session Properties
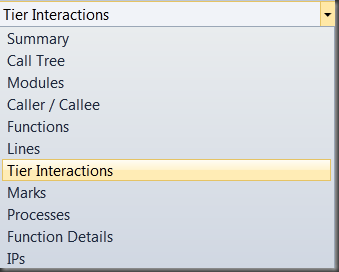
You are now ready to profile your application. Once you have enabled TIP and you have run your application under profiler, you can access “Tier Interaction” report from the list of available reports:
Figure 5 - Where to find Tier Interaction report
Start using Tier Interaction Profiling
Vast majority of 3-tier application performance bottlenecks are in how the application utilizes the database. Prior to VS 2010 Profiler, one needed to employ a large set of breakpoints, debugger traces, and SQL Traces to identify which query is being called the most and which query takes the longest to execute. With Tier Interaction Profiling in VS 2010 Profiler, you are merely a few clicks away from a report showing you the exact call count and timing information for each query executed in your application.
