Storport ETW Logging to Measure Requests Made to a Disk Unit
Greetings NTDEBUGGING community, Bob here again, and today I would like to let everyone know about a new feature implemented in the STORPORT.SYS binaries released in the following KB articles:
· KB 979764 (Windows Server 2008)
· KB 978000 (Windows Server 2008 R2)
Beginning with these new versions, it is now possible to measure timing statistics for requests made to a system’s disk unit. These measurements are taken at the lowest possible level of OS interaction with the storage adapter hardware, making it much easier to diagnose storage performance issues. The measurements are taken from the port driver, STORPORT.SYS, via ETW (Event Tracing for Windows). Windows drivers are implemented in a layered architecture, so in our case the STORPORT driver interfaces directly with the adapter or miniport driver. The STORPORT driver is responsible for managing requests and queues, and providing other upper level functions. Each miniport driver is specific to a particular storage adapter card, and knows how to deliver requests to the disk unit over the transport medium, like fibre channel for instance.
Configuring and Starting STORPORT ETW Logging
To measure storage performance, the user enters a threshold value via the GUI interface. (This can be scripted as well; see KB 978000 for details.) When an I/O time is equal to or greater than the entered threshold, an event 13 is written to the ETW log.
Here is a walkthrough to enable this feature via the GUI:
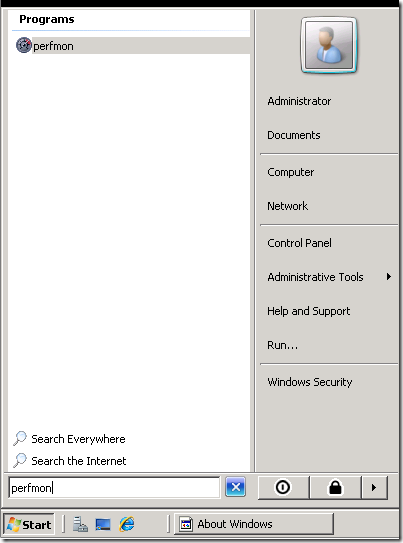
Click Start, type “perfmon”, and press ENTER to start Performance Monitor.
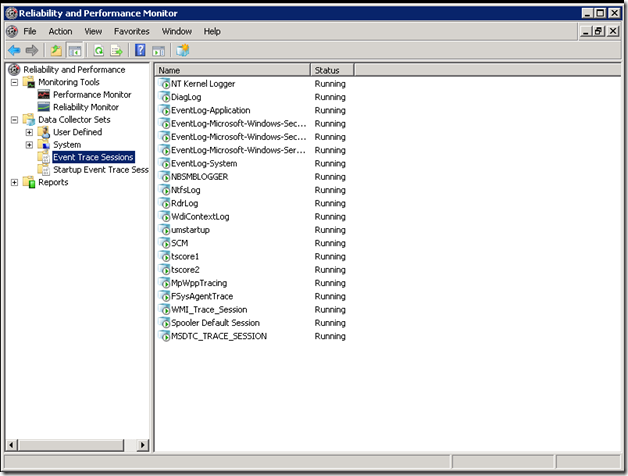
Expand “Data Collector Sets” and select “Event Trace Sessions”.
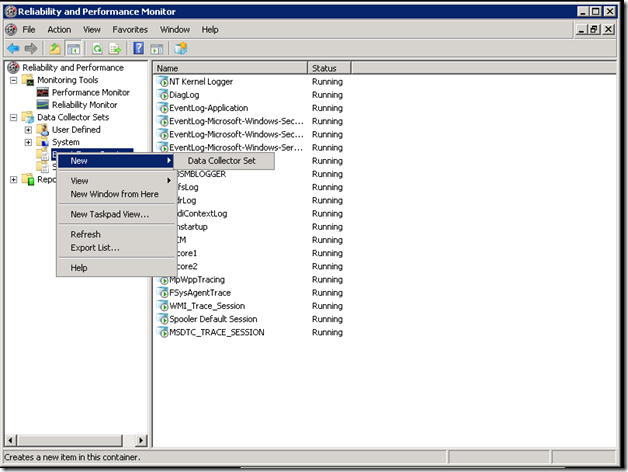
Right-Click on “Event Trace Sessions” and select “New -> Data Collector Set”.
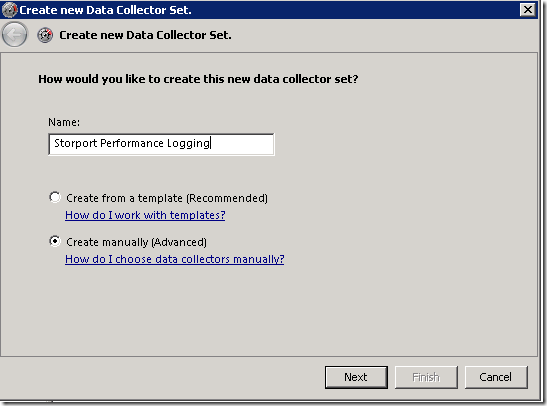
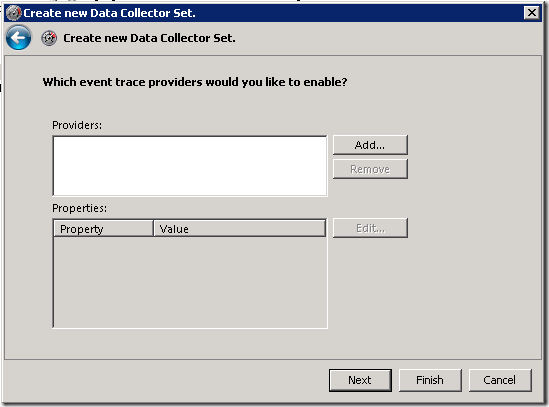
The following dialog will appear:
Give the new data collector set a name in the dialog box. In this example I called it “Storport Performance Logging”. Choose the “Create manually (Advanced)” optionthen click Next to see the following dialog.
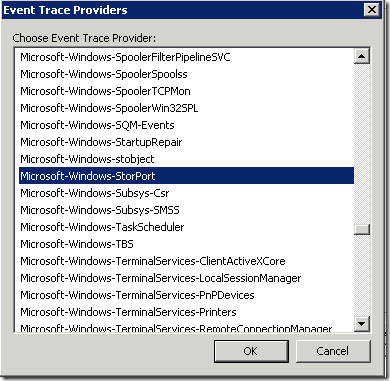
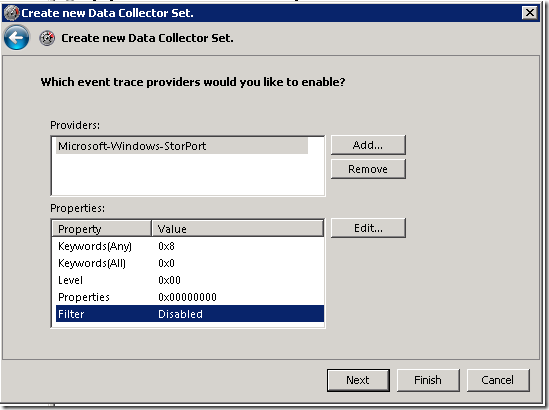
After clicking “Add...” on the dialog above the following list of providers will appear. Select “Microsoft-Windows-StorPort” and click OK.
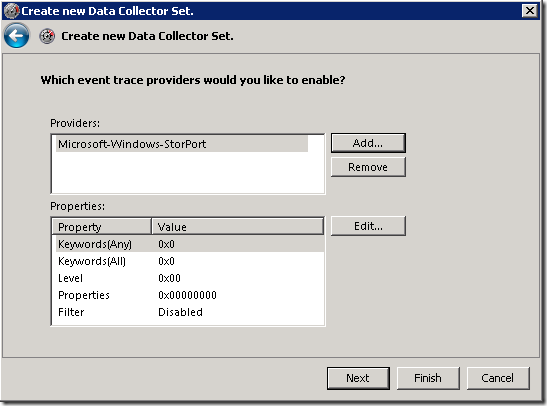
When the dialog below opens, select “Keywords (Any)” then click Edit.
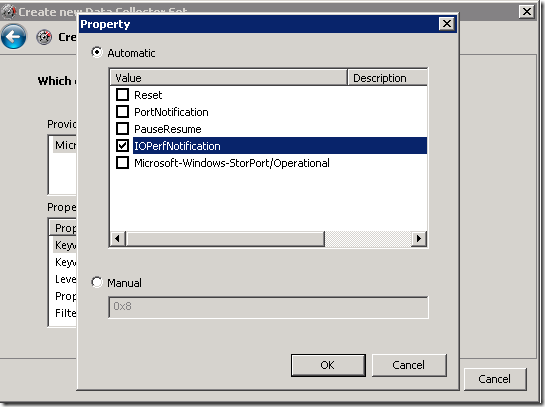
Check the box for IOPerfNotification, and then click OK. Note: For Windows Server 2008 SP1 and SP2, some properties may not be present (e. g. Reset, PortNotification and PauseResume).
Next, select “Filter” and click Edit…
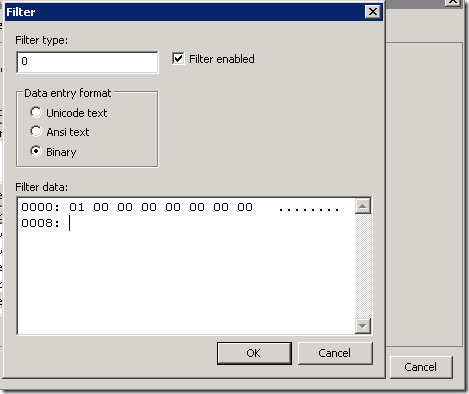
This is where we enter our time threshold. Remember that timing values greater than or equal to this filter value will be logged to the trace file.
Select “Binary” and check the “Filter enabled” box
In the “Filter data” field, enter the threshold value in the number of milliseconds. This must be entered in little endian format. Please refer to this table for the most common entries.
Decimal |
Hexadecimal |
Binary(little endian) |
1ms 5ms 10ms 15ms |
1 5 A F |
01 00 00 00 00 00 00 00 05 00 00 00 00 00 00 00 0A 00 00 00 00 00 00 00 0F 00 00 00 00 00 00 00 |
Note: The “Filter type” value will always remain 0 as in the example above showing an entry for 1 ms.
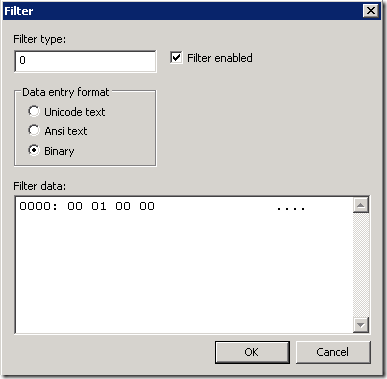
WARNING - The whole data line needs to be filled in when entering the threshold. For demonstration purposes here is the WRONG WAY to enter 256 ms. This will not work because of the missing 00 entries on the line.
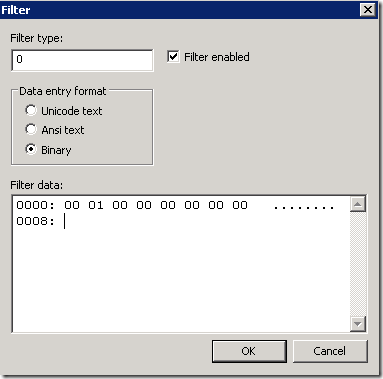
Below is the correct way to enter the value (256ms) Note: The Filter value may have to be re-entered for next run because it could get reset.
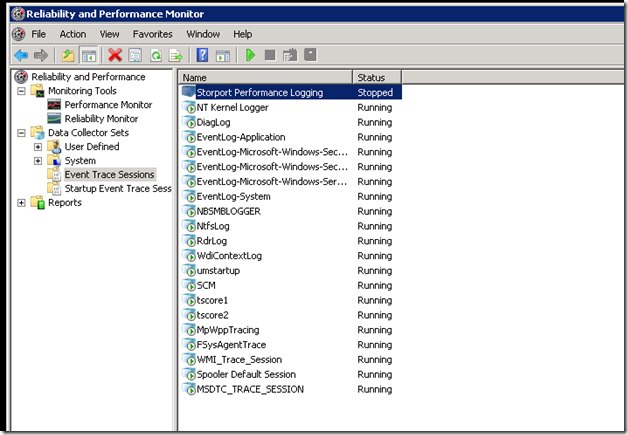
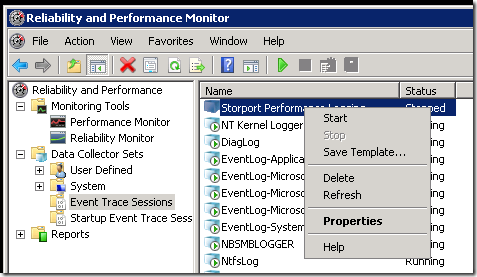
After clicking OK, you will see a new Event Trace session (screenshot below). Right-Click the new Event Trace session and select “Properties”
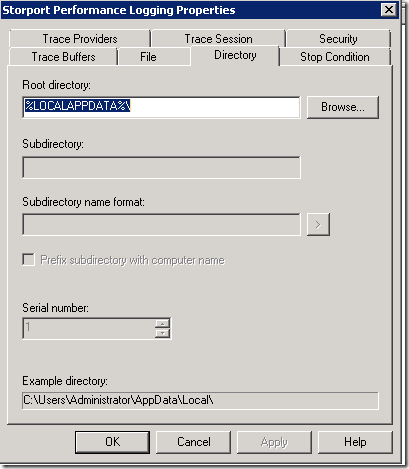
Next we need to set a location for the trace file. Ensure you have sufficient disk space in the target folder because logs can be many Megabytes in size depending on the number of hits.
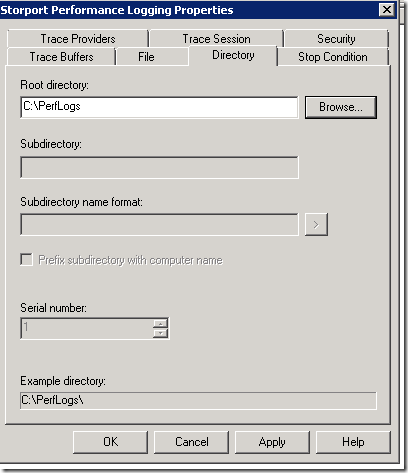
The target folder may be changed in the “Directory” tab
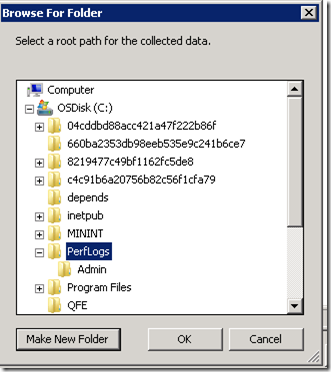
I recommend choosing a directory that is more easily located, like C:\PerfLogs, in which case you can click “Browse”
Note: It is not recommended to store the trace file on the same storage you are troubleshooting.
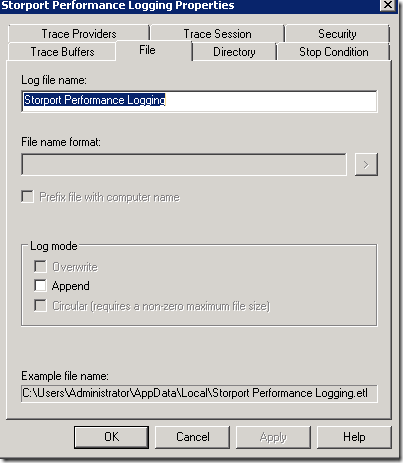
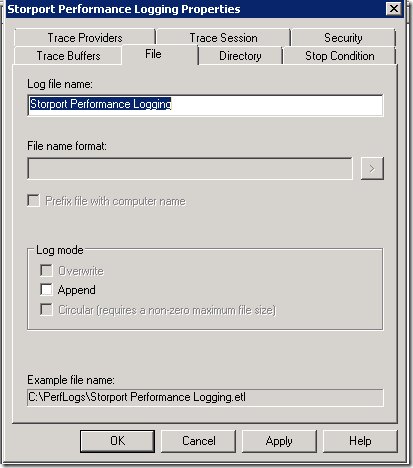
The name for the file is selected on the “File” tab.
When you are done setting the file and directory information click OK.
Now right-click the log and select “Start” to begin tracing.
The “Status” should indicate that it is running.
How long to run the log depends on you issue. You should let the log run until the issue or slow down occur then check the log for delays.
Viewing the Log File
First right-click and select “Stop” to flush any cached data and stop the logging.
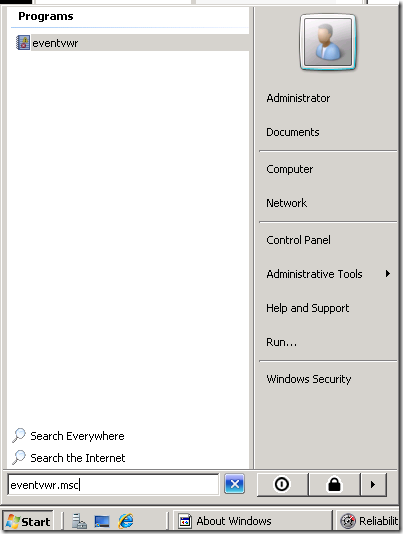
Then use Event Viewer to examine the log.
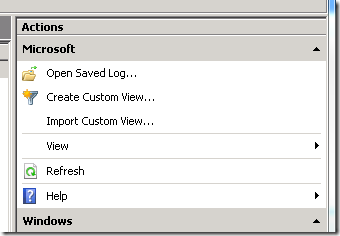
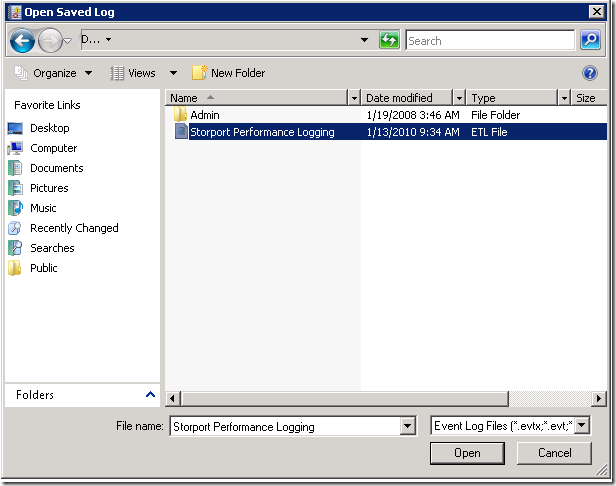
Next choose "Open the saved log…"
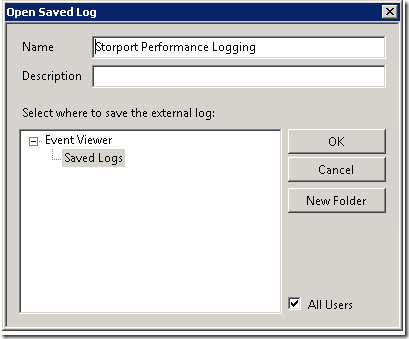
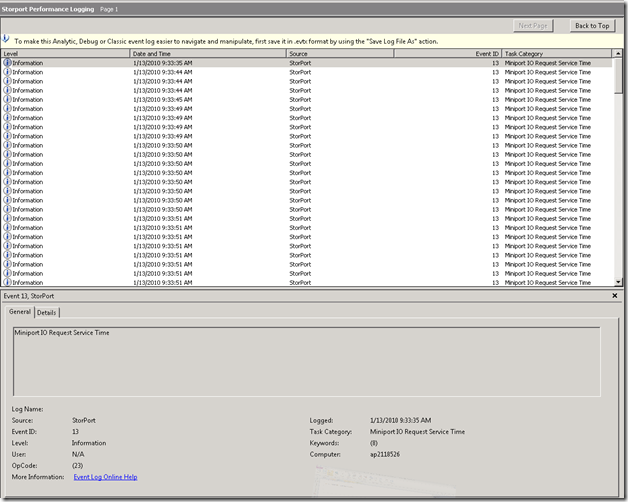
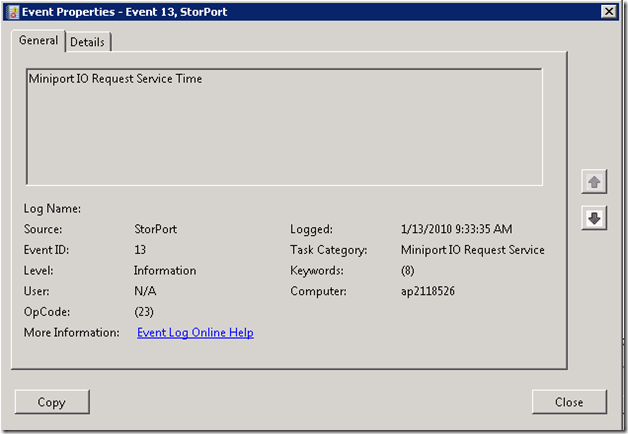
After clicking OK a popup dialog will be displayed to ask if you want to convert the log. Select “No”. Here is some sample event data that you will likely see in the log.
Example: Event ID 13
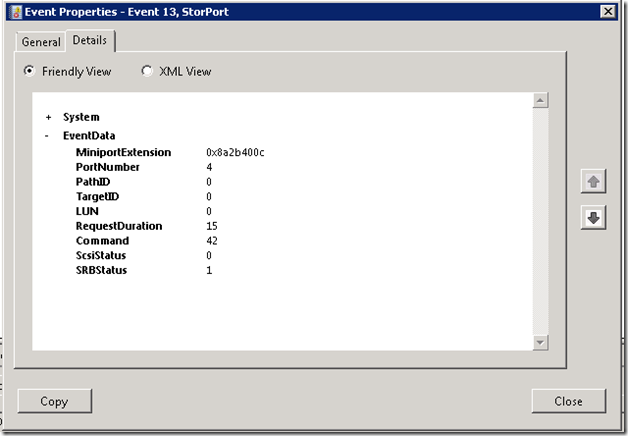
Let's examine the “Details” tab which shows information about the I/O that exceeded or equaled the threshold we had set. If you do not set a threshold, then all I/O events are logged, but for performance reasons we recommend setting a "reasonable" threshold like 15ms.
Breaking down the Event Data we have …
Miniport Extension: (Kernel address of the miniport extension, not of use to performance logging, only debugging)
PortNumber: This is the adapter port number (i.e. RaidPort1, etc.)
PathID: Path number if multi-pathing is in place
TargetID: Target LUN exposed to the Operating System
LUN: The Logical Unit Number of the physical storage where the particular I/O is directed
*RequestDuration: How long the request took in milliseconds (the number of note here for storage latency diagnostics)
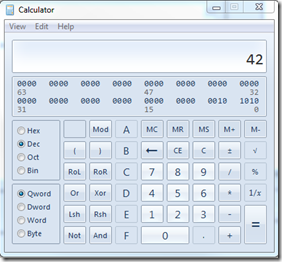
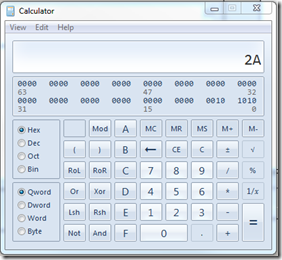
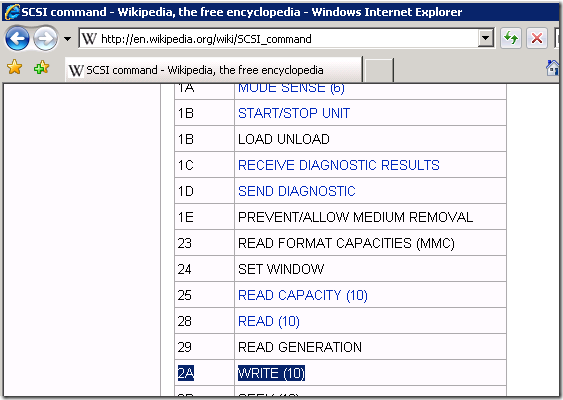
Command: the SCSI command sent to the unit. (Usually read or write) This is listed in decimal. Convert this value to hexadecimal with Calc.exe for referencing SCSI commands https://en.wikipedia.org/wiki/SCSI_command
ScsiStatus: the status that came back from the drive
SRBStatus: the status as returned from adapter (see srb.h and scsi.h in the Microsoft WDK or https://en.wikipedia.org/wiki/SCSI_Status_Code)
Example: Command 42 equals 2A which is a Write of 10 bytes.
Here’s the respective SCSI command:
When viewing the log, the commands will be mostly reads and writes. If I/O is determined to be slow at this level, then the issue is most likely disk or SAN related.
Hope you enjoyed the walkthrough!
-Bob
Comments
Anonymous
April 22, 2010
Hi, Can I use this to measure the performance of a SAN that provides the underlying storage for HyperV cluster shared volumes? thanks, Marc [ Hello Marc - It looks like I/O can be measured for VHD’s. However, they must be defined as SCSI devices not IDE.]Anonymous
April 26, 2010
Does this support Win7? I tried on Win7, I could not see " IOPerfNotification" selection in Win7. And I tried other selections, no luck to get ETW log successfully( the log file is always 8KB size). [ Yes, please install KB978000 to get the functionality. The title of the article is, "Add a fix to improve the logging capabilities of the Storport.sys driver to troubleshoot poor disk I/O performance in Windows Server 2008 R2". ]Anonymous
April 16, 2012
I am able to see "IOPerfNotification" on my [win7 Ultimate 64bit] and am able to enable the filter successfully. But when i start the data collector set, then go to the properties of the newly created data collector set, previous filter settings was set back to disable...,then there is no data logged in the .etl file. I can reproduce the issue, is it a bug? [I asked Bob about this. What youa re seeing is just the behavior of the logging interface. The settings are set they appear not to “stick” even though they are enabled. You should still be able to collect data using these instructions.]Anonymous
November 06, 2012
I install the hotfix in windows 7 but the etl file is always 8K. it is empty. what happened? how to fix this? [There will be no events logged if there are no requests slower than your time threshold. As a test you can set the threshold to a very low number like 1ms].Anonymous
January 16, 2013
Wayne, For the previous version of Windows you should see this blog: Widows 2008 and 200R2 version - Storport ETW Logging to Measure Requests Made to a Disk Unit - blogs.msdn.com/.../etw-storport.aspx Only SCSI commands go through the storport port driver. Are you sure you are using a SCSI device on your Winows 7? ATA disks use the ATAPort port driver that currently does not offer this type of tracing.Anonymous
February 21, 2013
Hello, Does the "RequestDuration" under this event indicate a SAN disk issue? I set the threshold to 15ms as in the demonstration. I'm trying to understand how to determine if the I/O is slow. Log Name: Source: Microsoft-Windows-StorPort Date: Event ID: 13 Task Category: Miniport IO Request Service Time Level: Information Keywords: (8) User: N/A Computer: VirtualServer Description: Miniport IO Request Service Time Event Xml: <Event xmlns="" rel="nofollow" target="_new">schemas.microsoft.com/.../event"> <EventData> <Data Name="MiniportExtension">0xfffffa8006fad4b8</Data> <Data Name="PortNumber">2</Data> <Data Name="PathID">0</Data> <Data Name="TargetID">0</Data> <Data Name="LUN">0</Data> <Data Name="RequestDuration">456</Data> <Data Name="Command">40</Data> <Data Name="ScsiStatus">0</Data> <Data Name="SrbStatus">1</Data> </EventData> </Event> [Yes, RequestDuration is how long the request took to complete. A time of 456 milliseconds would indicate a delay below the storport driver (miniport, HBA, Fiber, SAN, etc).]Anonymous
June 07, 2013
Is there any way to export the detailed information of thé event id 13 in a text, csv file to import this in excel ? [Event Viewer will allow you to save the log as .csv.]Anonymous
December 19, 2013
Hello: Very well written & very informative. I am not seeing “Microsoft-Windows-StorPort” in my provider list. I need help to populate in my provider list. Any help or info will be great help.Anonymous
December 19, 2013
from my above question, I have to install this hotfix. Add a fix to improve the logging capabilities of the Storport.sys driver to troubleshoot poor disk I/O performance in Windows Server 2008 R2 support.microsoft.com/.../en-usAnonymous
June 26, 2014
Hi, Is the RequestDuration for milliseconds? I'm hitting a performance issue and the same trace shows RequestDuration = 66,168,965, if it refers to milliseconds, that would be more than 18 hours. Is it actually for microseconds? thanks [A duration longer than the timeout value (typically 60 seconds) is a sign of a miscalculation and can likely be ignored. There are some scenarios where QueryPerformanceCounter may return inaccurate information, leading to an abnormally long duration such as what you saw. Usually this is due to a flaw in the hardware's counter. For more information see http://msdn.microsoft.com/en-us/library/windows/desktop/dn553408(v=vs.85).aspx.]
