Part 2 - Exploring and Decoding ETW Providers using Event Log Channels
Introduction and Overview
In this article we will explore a practical use for ETW tracing, and discover what ETW (Event Tracing for Windows) tracing is available for a popular Windows user-mode component, Internet Explorer. In my previous article ETW Introduction and Overview, we covered what ETW tracing is and how it could be used.
The goal in this exercise is to learn about ETW tracing in general, how to self-discover what tracing is available in a component, and some ways you can leverage the tracing to self-troubleshoot issues. ETW logging is essentially allowing Microsoft code to speak for itself. It tells you what code ran, what that code did, and any errors produced. Also ETW logs can be used along with a more traditional toolset for troubleshooting that class of issue such as the SysInternals tools, Network Monitor, etc.
For this article, we are using the RC Build of Windows 7. The concepts and examples should be very similar and work fine for Windows Vista.
Getting Started “Exploring”
First we start off by opening Internet Explorer 8 whose home page is set to the NTDebugging Blog - https://blogs.msdn.com/ntdebugging
In order to find what Internet Explorer is logging with ETW, we list all of the registered ETW providers on a box, which includes all of the installed code on the machine (the component doesn’t need to be actively running).
We start off by running “logman query providers” and look through the list for relevant hits. However, the results below return more than 400+ hits on Vista, and 600+ on Win7. You will probably quickly see though that searching through this large list of providers might not always be best way to go about finding which providers Internet Explorer is logging with.
Using this list we can also filter or browse for our component. This may work just fine, however, one issue with this approach is that sometimes you may not know the particular naming convention for a process. Also, many software components use shared dlll’s to do a variety of the under the hood work. As such, you may not know what each of those pieces of software are, or how they are named.
Here we try running a built-in cmd line tool logman ‘query providers’ and searching for “Internet”, which didn’t turn up anything on this particular search. It looks like the naming convention for Internet Explorer might be a bit different than our first search.
While we could continue to browse the large list of providers, I have decided to use another useful method to find which providers IE uses, which is to filter all providers that a certain ProcessId uses. We start out by getting the ProcessId of Internet Explorer using two methods shown here, Task Manager and the command line tasklist filtering on iexplore.exe.
Now that we know Internet Explorer is running with process id 6200, we can do another query with logman to find out the ETW providers.
Internet Explorer ETW Providers
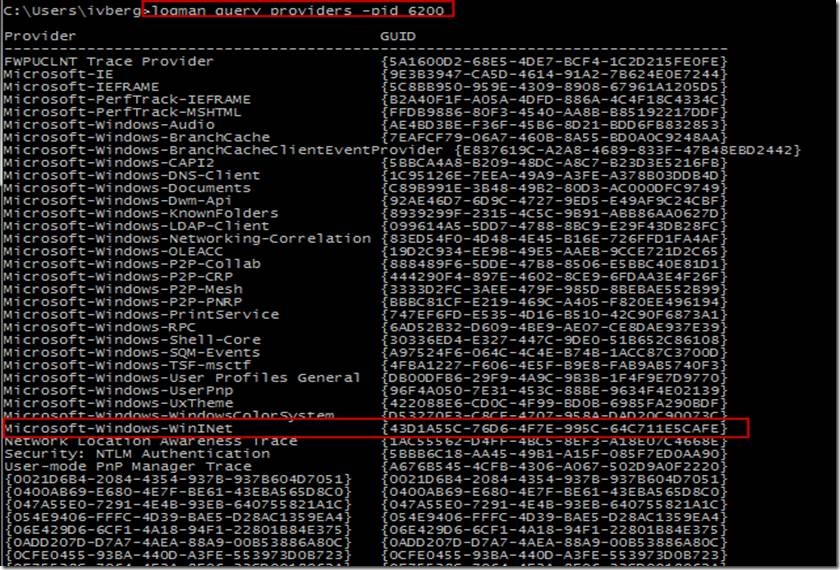
‘Logman query providers –pid 6200’ is used to list all of the user-mode ETW providers that Internet Explorer uses and the associated GUIDs (GUIDs are the Globally Unique ids that enable tracing for a component).
In looking at the screenshot below, notice that a wide variety of providers are shown, and at first glance, you may wonder how some relate to Internet Explorer. As you investigate further though, all these components enable certain features within Internet Explorer, but even with tracing enabled, may not log anything unless you specifically use the part of Internet Explorer which runs that code at run-time.
It is also important to note that Internet Explorer will also use a lot of kernel services to eventually do its work, such as NDIS. There is ETW tracing for these kernel components, but would not show up under a specific process as they are used by all processes at the kernel level. Here we see a specific component of interest that we want to follow – Microsoft-Windows-WinINet. A quick Bing search of WinINet turns up this on MSDN, which sounds relevant.
Extracted from MSDN: The Microsoft Windows Internet (WinINet) application programming interface (API) enables applications to access standard Internet protocols, such as FTP and HTTP. For ease of use, WinINet abstracts these protocols into a high-level interface.
So Microsoft-Windows-WinINet looks like a good component to enable tracing in.
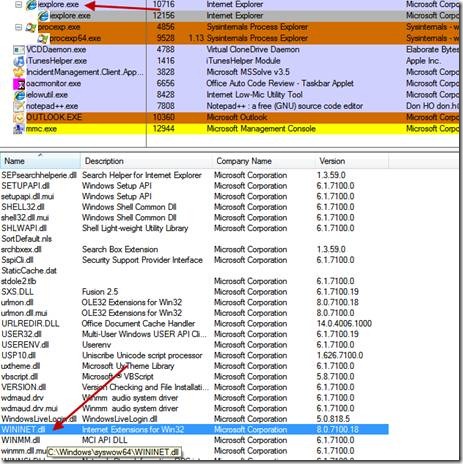
From using SysInternals Process Explorer you can also confirm and that WININET.dll is loaded into the address space of iexplore.exe as shown below.
Now that we know the ETW Provider name and GUID, we will launch Computer Mgmt and turn on tracing for that component. Note that not every Provider can be decoded this way (due to architectural and security reasons), but many can, and at the very least, the log can be enabled and provided to Microsoft Support to fully decode.
Launch Computer Management by typing ‘compmgmt.msc’ into the start search box or right clicking Manage on Computer Management.
Enabling ETW Logging
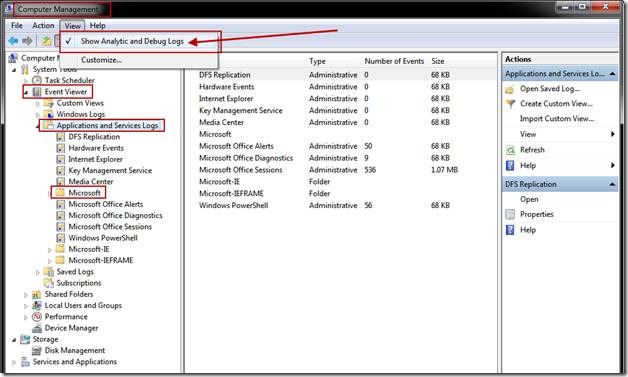
Once in Computer Management, Navigate to and click on Event Viewer -> Applications and Services Logs. Once there, make sure View -> Show Analytic and Debug Logs is enabled as shown below, which will provide a much greater set of logs to look at. Most logs are under Event Viewer -> Applications and Services Logs -> Microsoft -> Windows, where we will spend the majority of our time. There are generally four channels that can show up under each provider. Channels are targeted at different roles. Admin and Operational channels target IT professionals and Administrators and are enabled by default, while Analytic and Debug Channels are more in depth, and not usually enabled by default.
The logs that show up here are XML Manifest based tracing called Windows Events. ETW tracing splits up the collection and decoding of traces into two separate steps for performance and security reasons. In the manifest based tracing first available with Vista, most components and events are defined in a XML manifest compiled along with the binary, and which are defined in a resource file language dll. Most user-mode resource dlls show up under C:\Windows\System32\en-US (for English US). The good part about manifest based tracing is that many logs are self-discoverable and customer decodable!
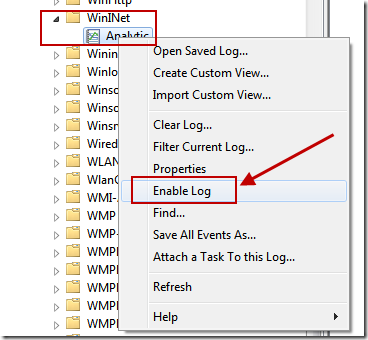
Next we will browse to: Event Viewer -> Applications and Services Logs -> Microsoft -> Windows -> WinINet, right click on the Analytic channel, and choose ‘Enable Log’. Remember that we had to enable this log because Analytic and Debug logs are not enabled by default. Enabling the channel will automatically enable the ETW tracing for that component and logs will start being decoded similar to the Event Log.
Capture and view WinINet logging for our scenario
After enabling the log, I am going to close Internet Explorer which is running code that is now logging using ETW and navigate to the website https://blogs.msdn.com/ntdebugging.
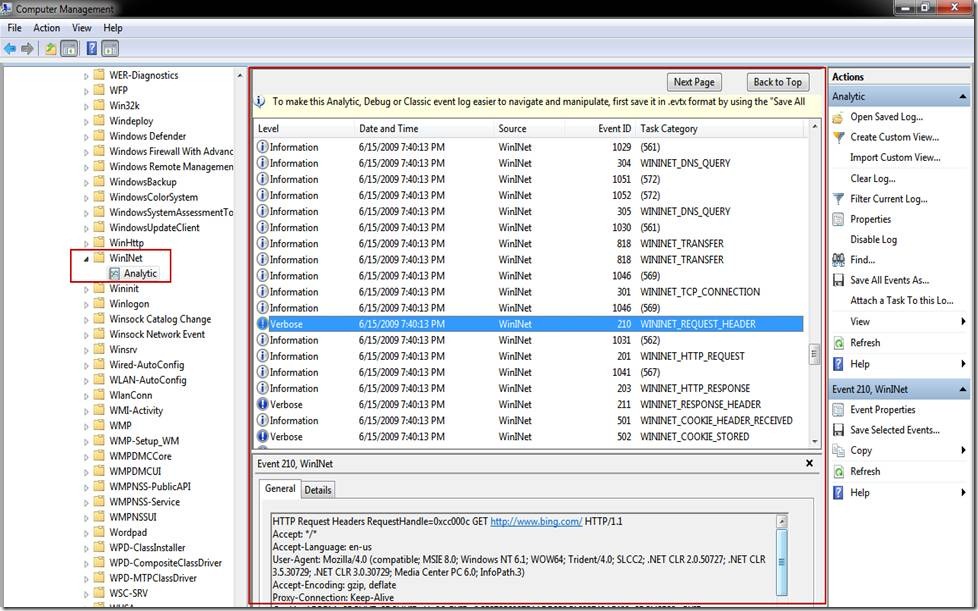
Now we can look at the result of our work and tracing, which decodes the tracing for us. Below, we are on the WININET_REQUEST_HEADER category, showing the GET request. Note that the tracing here is showing us proxy interaction, DNS requests and responses, cookies, TCP requests/responses, as well as HTTP requests and responses.
Now, one might be able to get the same information using a network capturing program such as NetMon or WireShark, but the nice thing about the ETW tracing here is that is
a) In box without having to install additional tools
b) The aggregate view of what the WinINet component is seen from its point of view (composed of DNS, TCP, Proxy, Cookies, etc).
This is a good example of using this tracing in combination with other troubleshooting tools (if required), which may or may not be useful depending on the scenario.
Dumping the trace log out using other methods:
You can use the Event Viewer GUI, or if you prefer to view the log in a text editor (or spreadsheet). You can dump the log to text or CSV format using a couple of different methods.
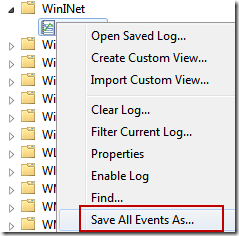
The first method is using the Windows Event Log GUI to export or save the event log
Or you can output the entire log to screen in human readable text format:
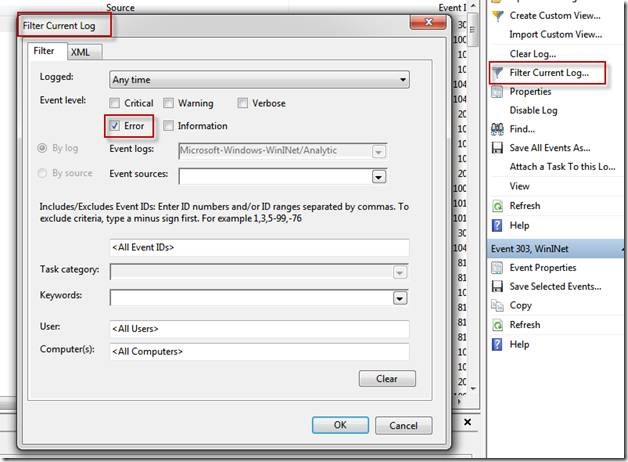
We can also output to the screen filtering for any messages with error level using an XPath Query. We can start right away if you know the XPath Syntax for your query, or you can use the GUI to help build the query for you. Once you choose ‘Filter Current Log’ you can filter by Event Level, or a variety of other criteria.
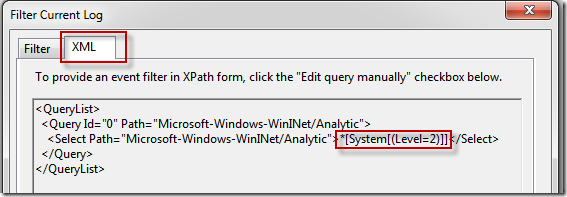
The XML view will show you the raw XPATH syntax needed to use wevtutil to query for only Error events.
Now we actually run the XPath query using ‘wevtutil query-events Microsoft-Windows-WinINet/Analytic /f:Text "/q:*[System[(Level=2)]]"’
If you prefer a more complex format containing processors, threads, etc, then you can output to a csv log file. This is useful for sorting, filtering, comparing, and doing more complex analysis on the log file entries.
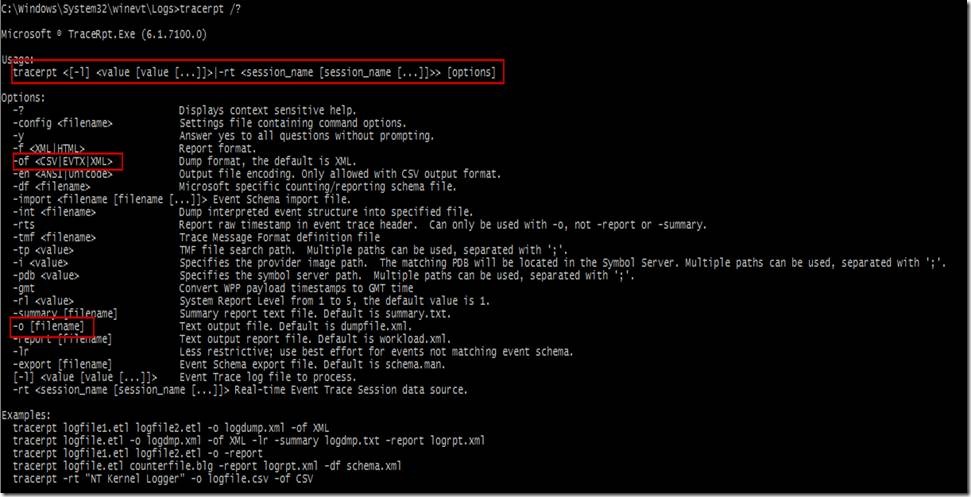
Here we use ‘tracerpt c:\windows\system32\winevet\logs\Microsoft-Windows-WinINet%4Analytic.etl –of CSV –o c:\temp\Microsoft-Windows-WinINet%4Analytic.csv’ to output to a CSV.
Finally, you can use PowerShell v2 to dump out the log. The PowerShell scenario is interesting, because you can write powerful scripts around the event logs.
Look at ‘get-help get-winevent –examples” for many more really cool examples about how to list and filter these logs:
Behind the Scenes
We also need to explore behind the scenes of what is happening when you enable the analytic channel of the WinInet provider. Part of the definition of that channel is to enable an ETW Trace Session with certain pre-defined Keywords (Flags) and Levels. Keywords usually specify functional sub-components (HTTP, COOKIES, CONNECTION, etc) while Levels control the level of detail (Error, Informational, Verbose) events are logged. This is useful to fine-tune logging, but the channels make it easy not to have to mess with these unless required.
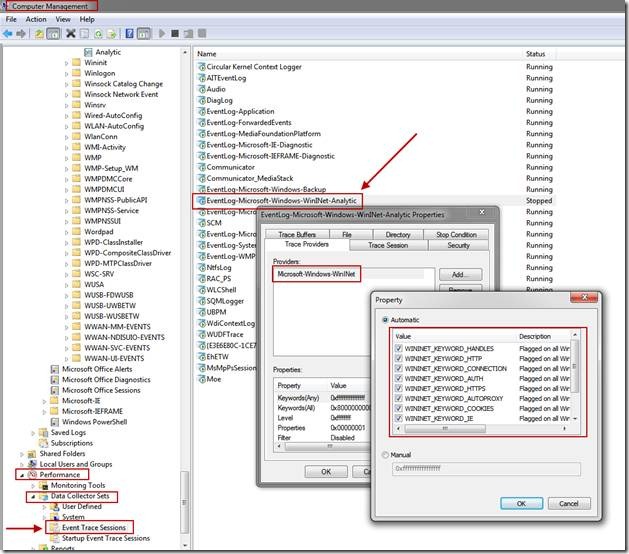
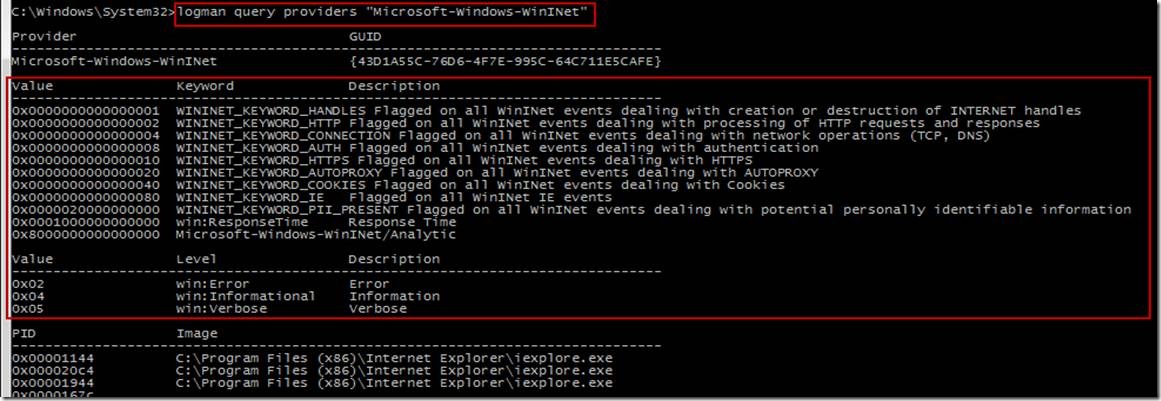
Under Performance -> Data Collector Sets -> Event Trace Sessions we see a new session created for us and auto-named “EventLog-Microsoft-Windows-WinINet-Analytic”. This ETW logger was automatically created for us when we enabled the WinInet Analytic channel. You can also manually create the logger, which we may cover in another blog post. If you open up the properties for this session, you'll notice our provider listed as well as all the Keywords (Any) and Level specified. The screenshot also show which Keywords/Flags or categories a provider supports.
Once you know a provider name, you can also query for it on the command line, which is useful to get all the Keywords(Flags) and Levels a provider supports, along with the processes that are using that provider.
For the curious, we wanted to finish this post and show you how to find what tracing is available, and its format. Here we again use the wevtutil to get full publishing event and message information.
‘wevtutil get-publisher Microsoft-Windows-WinInet /getevents /getmessage’
This can be combined with another version of the same utility searching for a certain string or log – e.g. “wevtutil gp Microsoft-Windows-WinINet /ge /gm | findstr /i httpopen”
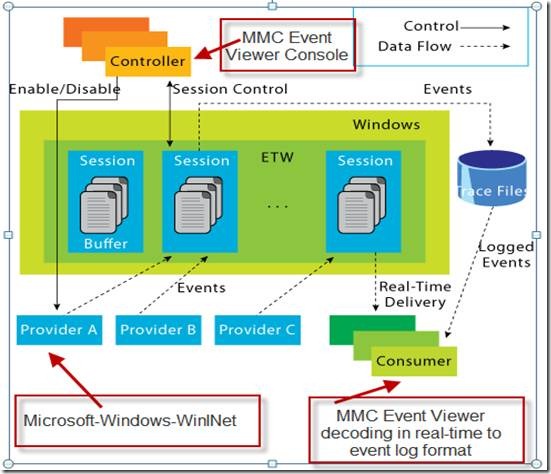
To wrap-up, here is the overall architecture of ETW covered in a previous blog post, along with the specifics of the scenario we covered. In our scenario the MMC Event Viewer console has two roles – enabling the tracing and decoding the real-time delivery of events.
Where to go from here?
This was meant as a practical introduction to using and self-discovering how to use the ETW tracing that is available right now in newer Windows releases (Vista/2008 and above). There are many, many more components that use tracing – 400+ in Vista and 600+ in Win7, which you can start exploring.
For these specific examples, it is worth noting that as far as the networking aspect is concerned, similar information might be obtained from using a packet capture utility such as NetMon. What is interesting about NetMon in Win7 is that it actually uses ETW under the hood to do most of its tracing. Here is an interesting post about Network Tracing in Windows 7from the Netmon team.
The use of ETW under the hood of many tools is a general trend in Windows and Microsoft software. You might notice different diagnostics and tracing tools in Windows using ETW under the hood. These tools can add value to the raw ETW tracing such as further parsing, filtering, and rich views into the data. You can mix and match these tools along with the tracing for powerful views into your Windows box or server.
It’s also important to note that ETW tracing isn’t just for Microsoft software. Since any software running on Windows uses many services provided by the OS, there is a variety of ETW logging that is available for all software. For example, try running ‘logman query providers –pid PROCESSID_OF_FIREFOX’ on FireFox! You should find a great deal of logging similar to Internet Explorer.
In future posts, we hope to explore other ways of using ETW tracing, and touch on some of the kernel level tracing available.
| Share this post : |  |
Comments
- Anonymous
July 01, 2015
How can I get the logman query output in a format I can then display in tabular form on a web page? [I am not aware of a way to have logman query display in a tabular format. You will need to parse the output.]



![clip_image001[1] clip_image001[1]](https://msdntnarchive.z22.web.core.windows.net/media/TNBlogsFS/BlogFileStorage/blogs_msdn/ntdebugging/WindowsLiveWriter/ExploringandDecodingETWProvidersusingEve_BA9A/clip_image001%5B1%5D_thumb.png)
