Configuring Visual Studio Code for PHP development
Updated March 17, 2016: added a link to the PHP topic on the VS Code documentation center.
Two weeks ago I was a speaker at the PHP Benelux conference, where I talked about Azure Machine Learning. For writing and debugging my demo PHP source code, I used Visual Studio Code.
In this blog post I’ll describe the steps for configuring VS Code for doing PHP development. For more details about how VS Code supports PHP, check out the PHP topic in the documentation center.
TL;DR
- Download and install Visual Studio Code
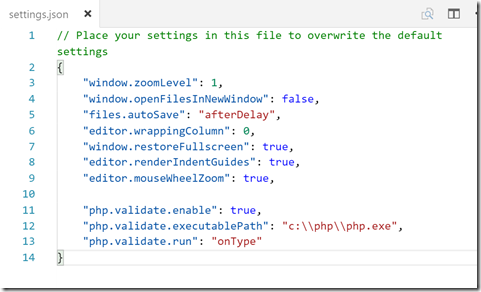
- Configure PHP linting in user settings
- Download and install the PHP Debug extension from the Visual Studio Marketplace
- Configure the PHP Debug extension for XDebug
Download and install Visual Studio Code
Visual Studio Code is Microsoft’s free, cross-platform lightweight code editor. While you download it (it’s only a 42MB download), let’s look a bit closer at what I just said…
- Free: indeed, VS Code is entirely free, no gotchas.
- Cross-platform: VS Code is available for Windows, Linux and OS X
- Lightweight code editor: as opposed to Visual Studio, VS Code is not a full-fledged IDE but a code editor. It’s a code editor with a number of powerful features you might also find in an IDE, such as intellisense, debugging and Git source control integration.
And by the way, VS Code is also open source – you can contribute to the sources or submit issues in the GitHub repository.
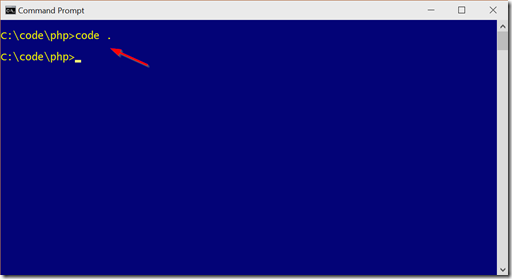
Once you have downloaded the installer package, set it up on your machine. You can find the detailed instructions here. You should now be able to open a command prompt and launch Visual Studio Code and start editing all files in a folder.
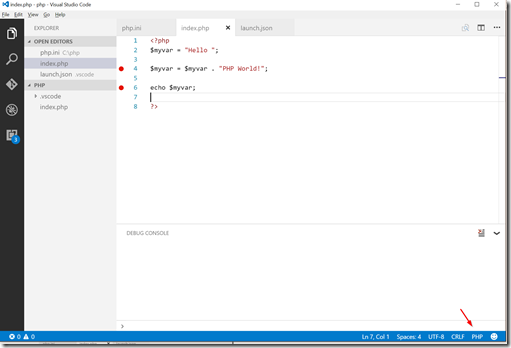
If you open a file with the .php extension, Code will recognize this file as a PHP file. Alternatively, you can manually change the file type through the Language Mode button at the bottom right of the editor or by pressing Ctrl+K and M keyboard sequence.
PHP out-of-the-box experience
VS Code supports many languages out of the box, and PHP is one of those languages. Note that more languages are supported through VS Code extensions in the Visual Studio Marketplace. For PHP we provide syntax coloring, bracket matching and code snippets.
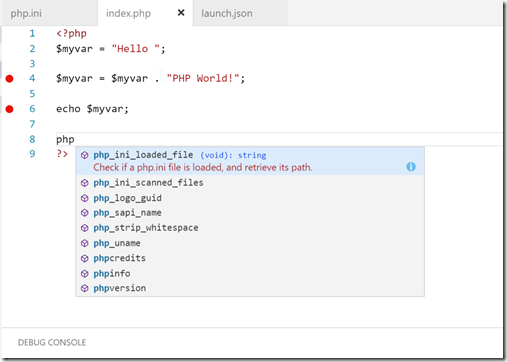
As you start typing code in a PHP file, you’ll notice that you get syntax coloring, bracket matching and IntelliSense as you type.
Configure PHP linting
By default, VS Code will perform PHP linting to validate your code when you save your file. To do so, it is using the php executable. As you use VS Code for the first time, you’ll get an error message that the PHP executable cannot be found.
As mentioned in the message, you need to specify the path the PHP executable on your machine. This is done in the settings file (VS Code has different levels of settings files, for more details check out the documentation). In this case, we’ll configure the PHP settings globally for the user.
Open the user settings through the command panel: press F1 > type ‘user’ > press Enter.
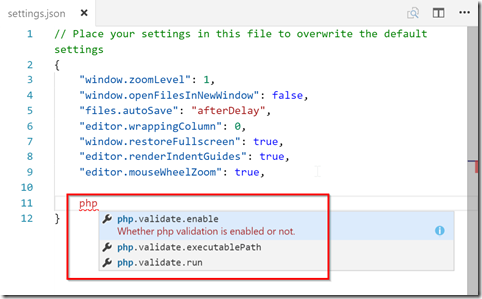
You will now get two JSON documents: the leftmost document are the default settings, on the right hand side you find the user settings. In the user settings you can override the default settings. For enabling PHP linting, we have 3 settings.
To configure the path to the PHP executable you specify it in the user settings file:
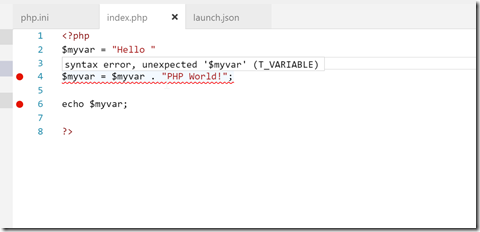
Now you should see validation enabled for you PHP files. In the event of invalid PHP, you’ll see a red squiggly lines in your source code (in below code sample, a semi-colon is missing on line number 2).
Configure debugging
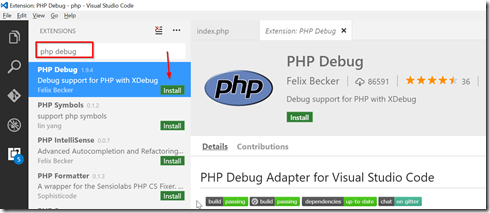
VS Code provides XDebug debugging support using the PHP Debug extension (kudos to Felix Becker!). First, install the extension from the VS Code command panel: press F1 > type ‘install ext’ and select ‘Install Extensions’. Then type ‘PHP Debug’ in the search box and install the extension. You will have to restart VS Code after installing the extension to activate it.
Note that this extension uses XDebug. Therefore you need to ensure that you have installed XDebug. You can download XDebug here (for Windows, you should get the non-thread-safe 32-bit version).
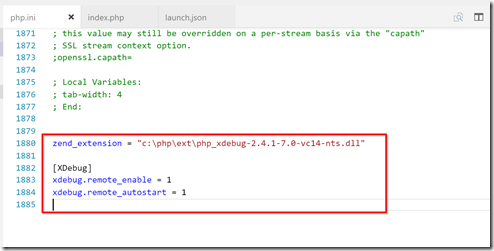
Then, update your php.ini file with the following settings. In my case, I have installed XDebug in the ext subfolder of the PHP install directory. If you installed XDebug elsewhere, make sure that zend_extension points to the correct location.
Make sure to point your webserver root to your project and each time you request a PHP file, XDebug will try to connect to port 9000 for debugging.
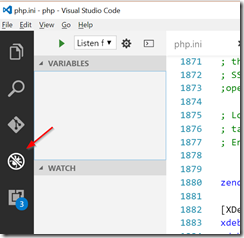
To start debugging, and navigate to the Debugging tab in VS Code.
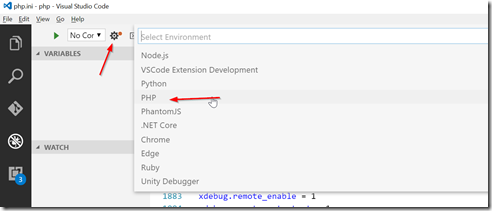
Then press the little gear icon to generate the launch.json file, which will allow VS Code to start the XDebug debugging session. Make sure to choose PHP as the debug environment.
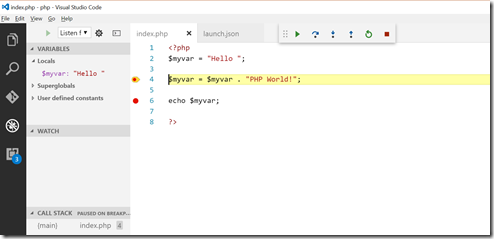
To start debugging you can press F5 or click the green arrow in the Debugging tab. You can set breakpoints in your source code by selecting a line and pressing F9.
If you now hit the specific web page, VS Code will break into your source code at the specified breakpoint. You’ll then get information about variables, call stack, etc. in the left hand pane.
Conclusion
Visual Studio Code provides great PHP language support out of the box, and with the PHP Debug extension you can now also debug your PHP code. And all this for free, and cross-platform.
There are more PHP extensions in the Visual Studio Marketplace for you to try out.
Links:
- VS Code extensions: https://marketplace.visualstudio.com/vscode
- More information about PHP support in VS Code: https://code.visualstudio.com/docs/languages/php
Comments
Anonymous
February 14, 2016
Hello Nick..great post. I followed the same procedure but I got the following error. Error: request 'attach': Attach requests are not supported in launch.json. How can I resolve this problem.Anonymous
February 17, 2016
@John: the PHP Debug extension doesn't support attach requests but only launch (marketplace.visualstudio.com/items). This means that you should launch the website from within VS Code and which will then break into your code when it hits a breakpoint.Anonymous
March 06, 2016
Possibly a dumb question, but can you clarify something for someone fairly new to web dev. In order to launch/debug php code from VScode, do I need to have a server already running, such as apache using something such as WAMP? Is there anything else required to set up the php side of things? When I try to launch my test code it is not working, and going to localhost:9000 sits and hangs so no doubt there is something silly I have not configured properly.- Anonymous
August 17, 2016
The comment has been removed- Anonymous
October 09, 2016
Indeed - thanks for the info.
- Anonymous
- Anonymous
Anonymous
March 06, 2016
@Derpy: you indeed need a web server on your machine for hosting your website. VS Code will then attach to XDebug. Either you can use the built-in webserver that comes with PHP (php.net/.../features.commandline.webserver.php - dev only!), or use a fully-fledged web server such as Apache or IIS.Anonymous
March 07, 2016
Thanks Nick. The basic php server appears to be running fine. Getting iis up and running wasn't going well, with fastcgi module option not being in the list and iisfcgi.dll not being on the system for some unknown reason.Anonymous
March 07, 2016
@Derpy: make sure that CGI is enabled on your machine. Check the following link to verify/enable it: technet.microsoft.com/.../cc753077(v=ws.10).aspxAnonymous
March 08, 2016
The comment has been removedAnonymous
March 09, 2016
@Andres: unfortunately, we don't yet have that functionality. This might actually be a good idea for a VS Code extension. Feel free to create such an extension. Alternatively, you could file a feature request in our GitHub repo.Anonymous
April 09, 2016
Hi Nick, great post on getting started with PHP in VS Code!I've just launched an extension onto the marketplace that may interest you - Intellisense for PHP :)Check it out here: https://marketplace.visualstudio.com/items?itemName=HvyIndustries.craneAnonymous
October 08, 2016
Hello!Been a while since I last used PHP and thought it was about time to try it out more seriously using a debugger and all. Found this guide and got ready to get going. However, half the guide seems to be in the images that are all missing. I can't get it working without them. Could you bring them back please?Thanks!- Anonymous
October 09, 2016
Images have been fixed - thanks for letting me know!
- Anonymous
Anonymous
November 15, 2016
Hi, I am having problems getting this working. I am running my site with IIS (Windows 10) on port 80. However whenever I go to http://localhost I get the error "connection closed" within the debug console.- Anonymous
November 15, 2016
Hi Lee,Can you confirm that the website is running correctly on IIS, without debugging it?If that works, can you check that the firewall is not blocking port 9000?Also check that the XDebug extension is enabled on your website - just add a quick phpinfo() to your page to validate.- Anonymous
November 15, 2016
Thanks for getting back to me Nick. Yeah the website runs fine. I'm just using Windows Firewall. I enabled logging and monitored for dropped packages but nothing indicates a problem. One small thing I can think of is that the IIS root is pointed at a "public" sub directory under the directory I have opened Visual Studio Code from. This is just speculation but so far I have been unable to find a solution. - Anonymous
November 16, 2016
All fixed. This was an issue between PHP Debug and Xdebug version 2.5.0 rc1 which the installer recommended. Switching to version 2.4.1 worked for me.- Anonymous
November 17, 2016
Great to hear. Thanks for posting back your solution. - Anonymous
November 23, 2016
Similar issue. I downloaded 64-bit WAMP with PHP version 5.6.25, xdebug vscode extension 1.10, Visual Studio Code 1.7.2. xdebug was recognized as specified in the phpinfo, I enabled logging in both xdebug and the vscode xdebug extension, I would see an error in the xdebug dll log... E: Could not connect to client. :-(I would see connect statements in vscode console from the extension, so could see that communication from both sides was attempted. PHP would run, but was unable to set any breakpoints.I did as Lee suggested, I went back to PHP 2.4.1 xdebug instead of the PHP 2.5 xdebug recommended and things started working. Thanks Lee!!Here is my zend extension info in my php.ini... [xdebug] zend_extension = "D:\dev\wamp64\bin\php\php5.6.25\ext\php_xdebug-2.4.1-5.6-vc11-x86_64.dll" xdebug.remote_enable = on xdebug.remote_autostart = on xdebug.remote_port=9000 xdebug.remote_host="localhost" xdebug.max_nesting_level = 512 ; xdebug.remote_log = "d:\dev\xdebug.log"- Anonymous
December 03, 2016
Can I develop code to interact with Serial COM port using VS Code PHP? If so can you please guide.- Anonymous
December 11, 2016
Hi Raks,VS Code is just a code editing tool and integrated debugger. Whatever you can do with PHP, VS Code allows you to start and debug.
- Anonymous
- Anonymous
- Anonymous
- Anonymous
- Anonymous
Anonymous
December 12, 2016
kintelaHi Nicke. Thanks for your post. I'm using MAMP so I have an Apache server running in localhost:8888 and it's pointing to this folder: applications/MAMP/htdocs. So I have my project under this folder to be able to attend correctly the requests. This woks fine but I have just installed Xdebug but I don´t know how to run my php file to debug. I need to tell XDebug where is my server anyway? VS Code can run itself the php file? Regards- Anonymous
December 12, 2016
@kintela your php.ini file should have a reference to the XDebug binary. If this is the case, you start debugging in VSCode. When you navigate to your website in a browser, VSCode will break on your breakpoint.
- Anonymous
Anonymous
December 29, 2016
Where can i find php.ini file?- Anonymous
January 02, 2017
You can find the php.ini file in the PHP installation folder. At first installation, you'll find a php.ini-development and php.ini-production file. You can use one of those to create a php.ini file.
- Anonymous
Anonymous
January 16, 2017
Has anyone got an example of a task problemMatcher for PHP? I'll cook my own but I'm surprised nobody else has.Anonymous
January 16, 2017
I am having difficulty in setting up Debugger to work using Visual studio code in Windows 10Validated the phpinfo() here: https://xdebug.org/wizard.phpwhen i click on Start Debug icon, it shows the stepover bar and nothing happens although i have breakpoints in the code.Am i missing something...or is there a way to see what's going on.test.php: settings.json: "php.validate.executablePath":"C:\Program Files (x86)\IIS Express\PHP\v7.1.0\php.exe", "php.validate.enable": true, "php.validate.run": "onType"launch.json: "configurations": [ { "name": "Listen for XDebug", "type": "php", "request": "launch", "port": 9000 },php.info: [XDebug] zend_extension = "C:\Program Files (x86)\IIS Express\PHP\v7.1.0\ext\php_xdebug-2.5.0-7.1-vc14-nts-x86_64.dll" xdebug.remote_enable = 1 xdebug.remote_autostart = 0- Anonymous
January 17, 2017
Have you checked your firewall settings? Xdebug listens on port 9000 by default (can be changed using the xdebug.remote_port setting). To enable Xdebug logging, add the xdebug.remote_log setting to your php.ini file (https://xdebug.org/docs/all_settings#remote_log). In that log file, you should find diagnostics about the Xdebug session. - Anonymous
January 20, 2017
into php.ini you should have xdebug.remote_autostart=1 (cf this page)Tell me if it solves your issue - Anonymous
January 26, 2017
I have the same issue. Trying to start debugging in VS Code doesn't work. php executable path is set, XDebug configs are set in php.ini. When i click on F5, when i open the browser, it keeps loading without showing any thing in the page.
- Anonymous
Anonymous
January 20, 2017
HelloDo you have an example of the launch.json configuration required and PHP.ini setting? (On my side it ignores the breackpoint)Other question : does it works with 64 bits as 32 bits?Regards- Anonymous
January 23, 2017
I would expect it to also work on 64bit - make sure to have both PHP and Xdebug on the same architecture. The default launch.json should work:{ "version": "0.2.0", "configurations": [ { "name": "Listen for XDebug", "type": "php", "request": "launch", "port": 9000 } ]}- Anonymous
January 26, 2017
I have my PHP ver. 7.0 MSVC14, and the same i installed for xDebug (NTS). I am still not able to run VS Code for my one php page on Windows 10. i can't disable the firewall, it is a corp machine. Any thoughts?
- Anonymous
- Anonymous
Anonymous
January 31, 2017
The comment has been removed- Anonymous
January 31, 2017
You can (re)define a keyboard shortcut to whatever action you prefer. Just go the Command Pallete (F1) and type Keyboard > choose 'Preferences: Open Keyboard Shortcuts'
- Anonymous
Anonymous
February 19, 2017
Hi Nick,Great post and thanks for the info.However I feel that this post maybe missing a few steps.You don't mention installing PHP, is PHP installed as part of the Debug extension or does it need to installed prior to your steps?I am used to Visual Studio "Run in browser", as I see it VS Code won't open up the browser when you debug, or if there a way to configure to debug with your favourite browser?Thanks,Luke- Anonymous
February 27, 2017
PHP is not installed as part of the extension.When debugging, VS Code doesn't open up your 'project' in the browser, however you might want to look at the 'PHP Server' extension, which allows you to host/serve the code and open it up in a browser.
- Anonymous
Anonymous
February 20, 2017
Hi. Thanks for the tutorial. But I'm wondering if you can set the phpExecutablePath to a remote server -- my dev environment is docker-based, specifically so that I don't have to install (asides VS Code and IDEs) any dev dependencies on my computer directly. So I'm wondering if you have a suggestion on how to adapt your suggestions for remote/docker-based environments?Thanks.- Anonymous
February 27, 2017
VS Code needs access to the executables for PHP, so you will need to expose those from your container to the host or to your dev environment. XDebug can do remote debugging - you can configure the xdebug.remote_host setting for XDebug to achieve this (see also the XDebug documentation: https://xdebug.org/docs/remote#communcation).
- Anonymous
Anonymous
February 25, 2017
I am still in problem, I am hobbyist website beginner programmer and I uses WebMatrix to learn. I dont know how to do that! there is a lot of problems in php executable path, "Cannot validate since c:\php.exe is not a valid php executable. Use the setting 'php.validate.executablePath' to configure the PHP executable."- Anonymous
February 27, 2017
When entering the path to the PHP executable, on Windows, make sure to use double backslashes (e.g. c:\php\php.exe). See above, you also need to make sure that PHP is already installed on your machine and that the user setting references the correct path to the php.exe program.
- Anonymous
Anonymous
March 04, 2017
The comment has been removed- Anonymous
March 05, 2017
Try this: http://www.forevolve.com/articles/2016/08/04/php-with-visual-studio-code-and-xdebug/I guess you are missing the "starting the server" part like I did. I spent whole day to find that missing part
- Anonymous
Anonymous
March 09, 2017
Is it possible to to use PHP installed in WSL?- Anonymous
March 10, 2017
You can run PHP in Windows Subsystem for Linux (see also: https://www.symfony.fi/entry/php-development-with-windows-subsystem-for-linux-wsl).With WSL, your PHP runs natively on your machine, so this should work as expected. Note that I have not tested this scenario myself - let me know how it works out for you.
- Anonymous
