Analyzing IIS Log files using Log Parser – Part 1
Working with SharePoint, I often find myself in situation where I need to analyze IIS log files in a variety of ways to understand what kind of load is being placed on the system. In an effort to make this easier for me, and others, I have tried to automate, script, etc., wherever possible.
The first pass that I typically run on the IIS data is to slice the IIS traffic by hour. IIS Logs files record their time in UTC; however, most people live/operate in a different time zone. In order to make the results more reflective of the actual user environment, you will need to adjust the times, either forward or backwards relative to UTC, to compensate for your particular environment.
The Scripts
For ease of use, I typically put my Log Parser scripts into a file and then reference them via the command line. This has the added advantage of allowing me to pass in arguments from the command line. As I mentioned before, I have two scripts – one for negative offset to UTC and the other for positive offset to UTC.
HitsByHourMinusGMT.sql
1: SELECT
2: SUB(QUANTIZE(TO_TIMESTAMP(date, time), 3600), TIMESTAMP(‘%tzoffset%’,’hh:mm’)) AS Hour,
3: COUNT(*) AS Hits
4: INTO
5: %destination% FROM %source%
6: GROUP BY
7: Hour
8: ORDER BY
9: Hour ASC
HitsByHourPlusGMT.sql
1: SELECT
2: ADD(QUANTIZE(TO_TIMESTAMP(date, time), 3600), TIMESTAMP(‘%tzoffset%’,’hh:mm’)) AS Hour,
3: COUNT(*) AS Hits
4: INTO
5: %destination% FROM %source%
6: GROUP BY
7: Hour
8: ORDER BY
9: Hour ASC
Traffic.cmd
1: @if /i "%DEBUG%" neq "yes" echo off
2: REM
3: REM Generate data for Traffic analysis
4: REM
5: @SET FileList=090715,090716
6:
7: @SET ServerList=1,2,3,4
8:
9: @ECHO Initializing...
10: FOR %%i IN (%ServerList%) DO @IF EXIST %%i.csv DEL %%i.csv /F /Q
11:
12: @ECHO Generating Traffic Analysis For Servers
13: FOR %%i IN (%ServerList%) DO @IF EXIST data\*%%i*.log LOGPARSER file:HitsByHourMinusGMT.sql?source=data\*%%i*.log+destination=%%i.csv+tzoffset="07:00" -i:iisw3c -o:csv
14:
15: @SET FileList=
16: @SET ServerList=
17:
The data
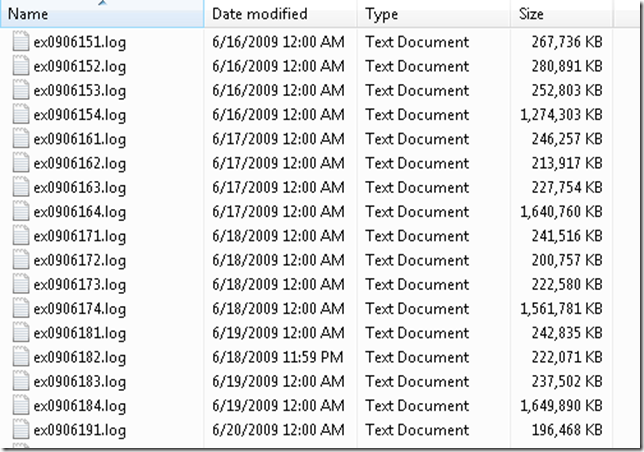
In order for all of this to work properly, we have to assume a minimum amount of IIS log fields have been captured. Typically, I will recommend that they all be captured. That gives you the most flexibility when it comes to parsing. Also, when I do this, I’m usually analyzing multiple machine simultaneously. In order to do that efficiently, there has to be some type of naming scheme in use to differentiate the various log files from one another. It may be as simple as adding the server name/number to the beginning/end of the filename. In our example, we have the following:
- ex0907151.log
- ex0907152.log
- ex0907153.log
- ex0907154.log
Let’s break this name down just a bit.
- 090715 – yymmdd that the logfile as captured
- 1,2,3,4 – indicates server1, server2, server3, and server4. It could have just as easily been the server name
The command line
For the purposes of this example, I’m going to assume that the servers we’re getting data from are located in Redmond, WA (where else :-)). That is an offset of UTC-7 hours. Also, to make things a bit easier, I want to generate a file per machine. So, the command would resemble the following:
logparser file:HitsByHourMinusGMT.sql?source=ex0907151.log+destination=1.csv+tzoffset=”07:00” –i:IISW3C –o:csv
logparser file:HitsByHourMinusGMT.sql?source=ex0907152.log+destination=2.csv+tzoffset=”07:00” –i:IISW3C –o:csv
logparser file:HitsByHourMinusGMT.sql?source=ex0907153.log+destination=3.csv+tzoffset=”07:00” –i:IISW3C –o:csv
logparser file:HitsByHourMinusGMT.sql?source=ex0907154.log+destination=4.csv+tzoffset=”07:00” –i:IISW3C –o:csv
This will create 4 csv files that contain data for each server. What if we had a lot of days and multiple servers? This approach would get a bit tiresome. Let’s leverage the command line a little bit more to do the heavy lifting.
I have multiple days worth of data in a folder called, appropriately enough, data.
By modifying the FileList variable in the Traffic.cmd script, I can account for all them. Now, if I simply run the Traffic.cmd script from the command line, it generates a csv file per server. The output should look something similar to the following:
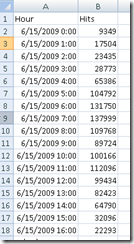
If we look at the contents of one of these files, we see the following:
This is a breakdown, by hour, of the number of hits that this server received. A hit is defined as anything that generates a line in the IIS Log file.
Now what?
Well, we’ve got all these raw numbers that we need to do something with. Let’s pull them into Excel and graph them to see if we can see anything that interests us.
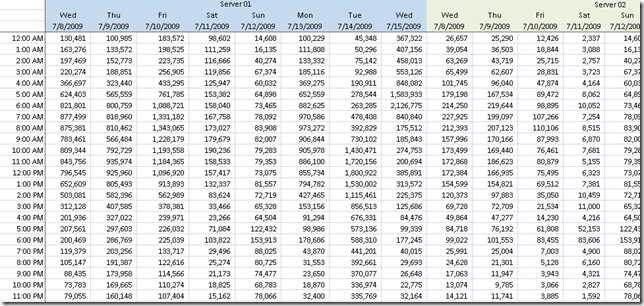
Let’s create a simple spreadsheet that contains a summary of all of the data. I like to break it out by server, by date, etc.
As you can see, down the first column are the times (localized to the server timezone), and then the hits/hour for each day for each server. So now what? This is good information (I think) but what do I do with it? Well, you use Excel to do what Excel does best – you create some graphs so that you can see patterns in the data. In this case, the graphing could not be simpler. We are simply going to create line graphs per server/per day.
Let’s talk about some of things that these graphs are telling us:
- On 8-Jul-09, Server 01 was bearing most of the load peaking at close to 900K hits/hour. This load appears to be fairly well distributed across the normal business hours of the day and represents what you would expect to see.
- Assuming that the farm in question is well balanced, you would expect to see similar traffic across each node throughout the course of the day. That is not what you are seeing. Clearly, on 8-Jul-09, Server 01 & Server 02 are shouldering most of the traffic. On 15-Jul-09, Server 04 is getting a large spike in traffic in the early morning hours before leveling out for the remainder of the day. The farm appears to be better balanced; however, we still have some unexplained spiking that bears further investigation
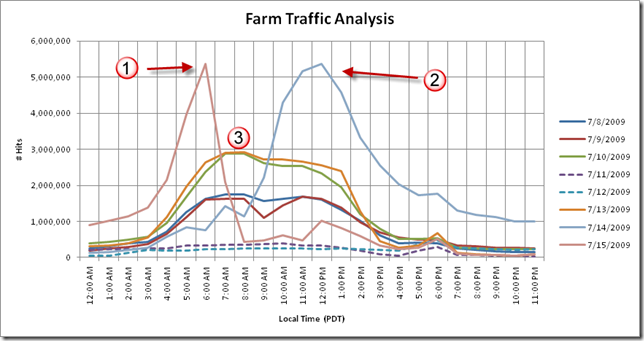
Another view that I find useful is to look at the aggregate traffic per day per hour across the farm to get an idea of what daily traffic patterns look like. All things being equal, I would expect to see roughly the same type of pattern during weekdays, a decline during the weekend, etc.
There are several notable areas of interest that warrant further investigation
- Why do we see such a massive peak here? It’s not only uncharacteristic but it is also, presumably, in the early, pre-business hours. What is generating such a heavy load on the farm?
- Again, we have another uncharacteristic peak during the middle of the day. Normally, this wouldn’t cause too much concern; however, when you look at compared against the other days, it really stands out. Why? Did the server experience larger than expected traffic? Did it go live on that day?
- If we look at these days together, the pattern looks normal. A gentle rise, levels off for a bit, and then declines. This is the pattern I would expect to see during a normal business day. However, this traffic begins to increase around 3:30am. levels off about 6:30am and then starts to decline around 1:00pm. This is an atypical traffic pattern as compared to the other days
Something to keep in mind while you’re analyzing this type of data is patterns. Patterns are very difficult to discern from a small dataset; so, the more data you have to analyze/graph, the better.
In the next installment, I will take a look at dissecting the IIS logs by unique users/IP addresses to see who is doing what where.
Enjoy!
Comments
Anonymous
July 23, 2009
This is great info Mike. I found the post while trying to figure out how to align all my server's timezones for aggregation. Would you be willing to share a sample of your excel sheet for those of us who are Excel Chart challenged? NateAnonymous
December 01, 2010
Wonderful! I have a basic question though. Is there a way I can run select query in multiples IIS log at one go. I have 100 IIS log files to pull the data from. What is the best way to do that. I am not that good in writing the join select query. Helen http://www.ekhichdi.comAnonymous
February 28, 2011
Thanks for the detailed post! I really like the chart visuals. Most people I know use a commercial reporting product but it's great to know how to chop up the data manually.Anonymous
September 10, 2013
Any way to get the images back? I was following along quite nicely until the pictures disappeared!


