Windows Azure Storage Analytics SDP Package
In a previous post we looked at the Windows Azure PaaS SDP package which allows you to quickly and easily gather all of the log data to determine root cause for a variety of PaaS compute issues. This post will look at a new SDP package which allows you to quickly and easily gather all of the storage analytics logs.
Getting the SDP Package
This package will only work on a Windows 7 or later, or Windows Server 2008 R2 or later computer.
- Open PowerShell
- Copy/Paste and Run the following script
md c:\Diagnostics; Import-Module bitstransfer; Start-BitsTransfer https://dsazure.blob.core.windows.net/azuretools/AzureStorageAnalyticsLogs_global.DiagCab c:\Diagnostics\AzureStorageAnalyticsLogs_global.DiagCab; c:\Diagnostics\AzureStorageAnalyticsLogs_global.DiagCab
Alternatively you can download and save the .DiagCab directly from https://dsazure.blob.core.windows.net/azuretools/AzureStorageAnalyticsLogs_global.DiagCab.
Running the SDP Package
- Enter the storage account name.

- Enter the storage account key. Note that this key is only temporarily used within the SDP package utility. It is not saved or transferred.

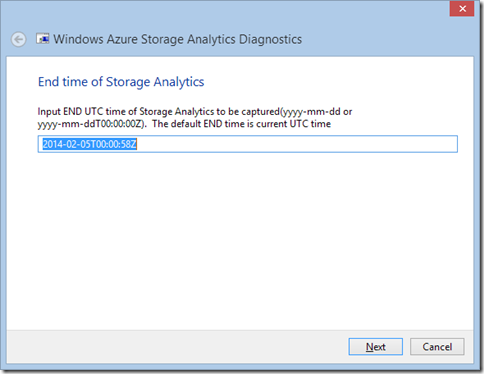
- Enter the starting time and ending time. The default values will gather logs from the past 24 hours
 .
.
- Select the analytics logs to gather.

- When the tool is finished gathering data click Next and an Explorer window will open showing the latest.cab which is a compressed file containing the most recent set of data, along with folders containing the data from each time the SDP package was run.

The Results
There will be several files created as a result of running this SDP package. The important ones are:
- ResultReport.xml. This file lists the data collected and includes the storage account name and time range specified. In the future we will include intelligent analytics results within this file (ie. “Event <x> found in Blob logs. This usually indicates <y>. You can find more information at <link>”).
- *.csv. This are the raw data files containing the logs and metrics. A header line is included in the file to make analysis easy. The headers correspond to the Logs format and Metrics format.
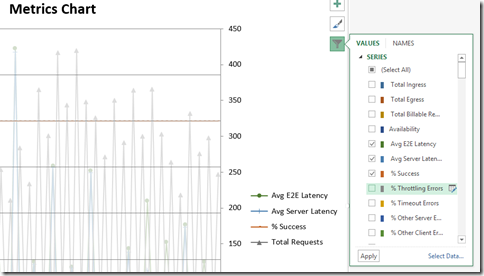
- *.xlsx. If Excel is installed on the computer running the SDP package then these .xlsx files will be created which include pre-built charts showing the most commonly used metrics along with the option to select additional metrics.
Excel charts (*.xlsx)
You can add or remove metrics from the Excel charts using the standard Chart filter tools:
Logs (*.csv)
You can easily filter and sort the .CSV files within Excel. The following filter can help identify potentially inefficient queries by identifying requests that take longer than X number of milliseconds on the server:
Look for additional blog posts in the future which walk through using the analytics data to identify and solve common issues.
Additional Resources
https://msdn.microsoft.com/en-us/library/windowsazure/hh343270.aspx – In depth documentation about storage analytics and what each field means.
https://www.windowsazure.com/en-us/documentation/articles/storage-monitor-storage-account/ – How to enable and use metrics from the Azure Management Portal.
https://channel9.msdn.com/Series/DIY-Windows-Azure-Troubleshooting/Storage-Analytics – A short 5 and a half minute video showing how to enable and use storage analytics.
Comments
Anonymous
June 04, 2014
Thanks, very helpfulAnonymous
February 18, 2015
For those who like downloading their traces and logs themselves, there's also an OSS Solution: github.com/.../WindowsAzureRetrieveStorageLogs

