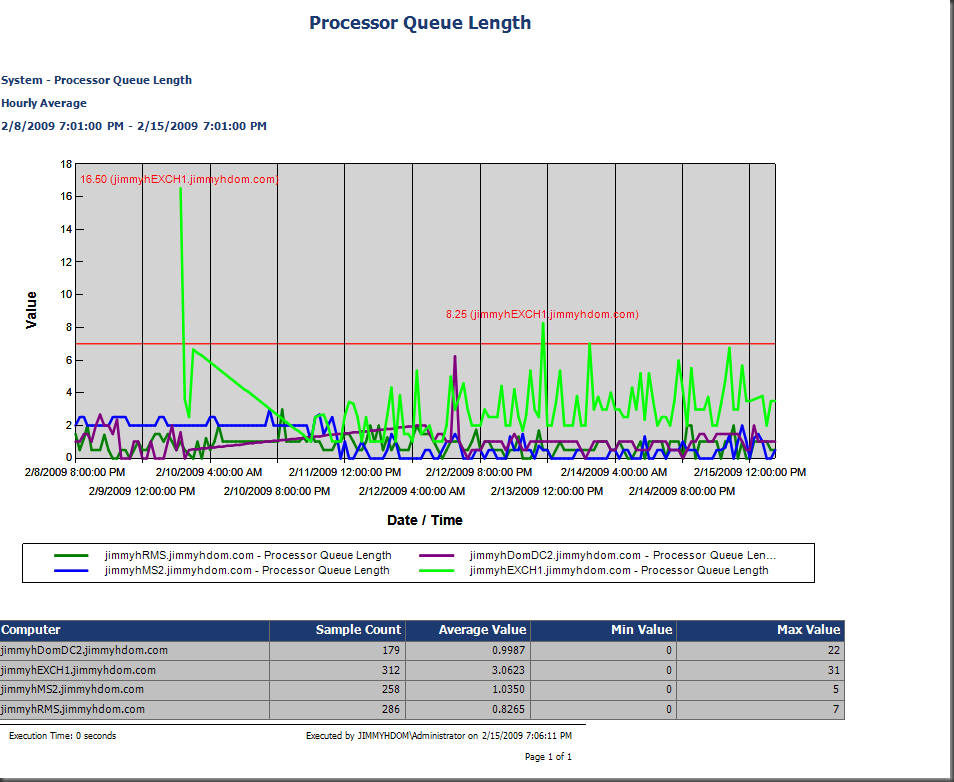
Custom performance report with threshold line
I recently had a need to create an OpsMgr report to show performance data with a "threshold" line, so that it would be easy to see data points that went over a defined threshold. We can't do this with the built-in generic performance report, so I put together this one:

The following parameters are available in the report:
Start Date / End Date
Time range that we are interested in.
Object Name
Select the performance object that you are interested in. This is populated by the objects in the vPerformnaceRule view in the Data Warehouse database.
Counter Name
Select the counter that you are interested in. This is populated by the counters in the vPerformanceRule view, based on the Object that was selected.
Computer
Select the computers that you are interested in. This is populated with a list of computers that have data in the Data Warehouse for the performance object that was selected.
Threshold Line
Optional. Enter a value for the threshold. A red line will be drawn at this value on the chart, and any data point above this value will be labeled with the computer name and the value for the data point.
Min / Max Sale Value
Optional. This is the minimum and maximum values to for the "Value" axis on the chart. If not defined, these will be calculated based on the values of the data returned.
Data Type
Select the data set to use from the Data Warehouse....options are "Hourly" (hourly average of the data points), "Daily" (daily average of the data points), and "Raw" (all data points).
GMTOffset
I don't have the cool time zone selector in this report, so you'll need to enter the GMT offset for the time zone that the data should be converted to (data in the Data Warehouse is stored in GMT time). For example, if the computers you are interested in are in New York (Eastern Time), you would enter "-5" (without the quotes).
Report Title
Enter a title for the report
NOTES:
- This re.port will not work correctly if run directly in SQL Reporting Services, it must be run from the OpsMgr Console.
- I haven't tested this with all perf counters, so some may not look too pretty in this chart
- After importing the report into SRS, you'll need to fix the data source to point to your "Date Warehouse Main" data source......I'll soon post a blog on how to add reports to a management pack so this can be avoided.
Perf Chart with Threshold Line.rdl
Comments
Anonymous
January 01, 2003
The comment has been removedAnonymous
January 01, 2003
That happens if you are running the report in the SQL Reporting Services UI....it doesn't support laying one chart on top of the other. In order for it to work properly, you'll need to run it from the OpsMgr Console.Anonymous
January 01, 2003
To import the report, just go to your SQL Reporting Service site, open the folder that you want the report to be in (or create a new one), and click on "upload file" and browse to the .rdl file. After importing, be sure to go to the properties of the report and change the data source to point to your Data Warehouse Main data source (this is something that I should have corrected before posting the report). Also, remember that this report will only work correctly if run from the OpsMgr console...it won't work when run from the SQL reporting services site. Let me know if you have any trouble and I can just add the report to a Management Pack that can be imported.Anonymous
January 01, 2003
For a report like this, where it is written for the data parameters to default to "Today-7" and "Today", you would need to use the SRS web UI to set up a subscription and select "Use default" for these parameters...the OpsMgr UI does not have a "use default" option. However, I'm not sure that this particular report will work properly when scheduled, as it does not display properly when run through SRS, it only works when run through OpsMgr....but give it a try and see if it works.Anonymous
January 01, 2003
...Or better still, is it possible to show the steps for creating this report? It looks great! Many thanks, John BradshawAnonymous
January 01, 2003
The comment has been removedAnonymous
January 01, 2003
The comment has been removedAnonymous
January 01, 2003
PingBack from http://time-sites2008.freehostia.com/?p=32018Anonymous
September 18, 2011
We are Using SCOM 2007 R2 and the report doesnt give graphs for most of the counters that i select and also the ones i get some graph for doesnt dispaly the graph properly.Anonymous
September 22, 2011
Anything we can do. the report generates the results as distored. Does it work with scom 2007 R2Anonymous
November 10, 2011
We have got two graphs instead of one graph as shown from your article above (threshold graph separated from the actual performance graph). Does this report supported in SCOM2007 R2 environment?Anonymous
November 13, 2011
The comment has been removedAnonymous
December 12, 2015
Dear shared report not working properly in SCOM 2012, its showing empty graph area.