How to debug an exception with the Visual Studio 2010 Historical Debugger
In a previous blog, I covered how to debug a LINQ to SQL query using the Historical Debugger. In this blog, I'll discuss using the Historical Debugger to debug an exception. The are a couple of reasons why the Historical Debugger is so useful when it comes to debugging exceptions:
- If your application handles the exception (catches it), you can see where it occurred
- You can see what happened before and after the exception. The ramifications of this capability are tremendous!
- You can double-click on an exception and go directly in your code where the exception occurred or was handled.
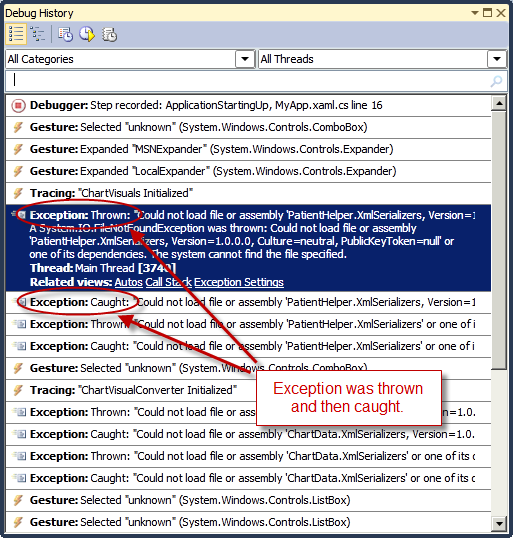
Let's go through an example. In the following screenshot, you can see that there are a number exceptions that were both thrown and caught. This is indicated by the Exception: prefix.

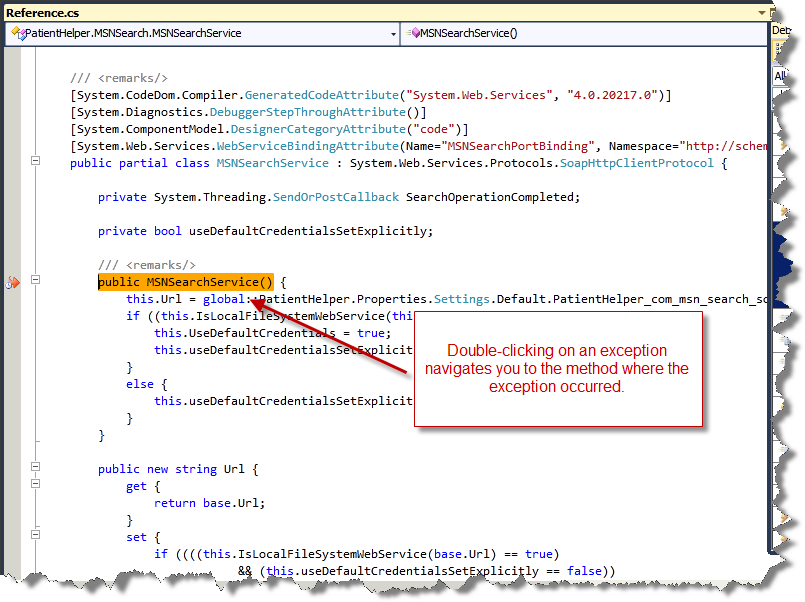
Double-clicking on the exception above brings up the source window and displays the method where the exception occurred.

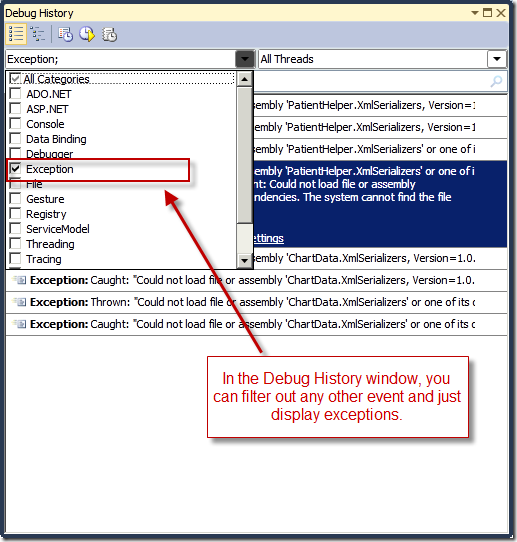
Last but not least, using the Debug History window, you can filter out all other events and only display exceptions, as shown below.

Habib Heydarian.