An in depth look at the Historical Debugger in Visual Studio 2010 (Part II)
In Part I of this post, I talked about the Application Event Recording capabilities of the Historical Debugger. In this segment, I’m going to look at another capability of the Historical Debugger which is Playback Debugging or what some people refer to as Time Travel Debugging.
Stepping Back in Time
For many developers, the one feature that has consistently been on the wish list is the ability to step back in the debugger. The classic problem of "one step too many" makes many developers wish that they could somehow rewind the debugger and hit play again. Obviously, you can restart the debugger and try and repro the problem but that is not ideal for a number of reasons including not being able to reproduce the bug, non-deterministic behavior such as multi-threading, etc.
The concept of being able to rewind, fast forward and play is universally known thanks to cassette players, VCRs and now DVRs like TiVo. The Historical Debugger brings the same concepts to the world of debugging.
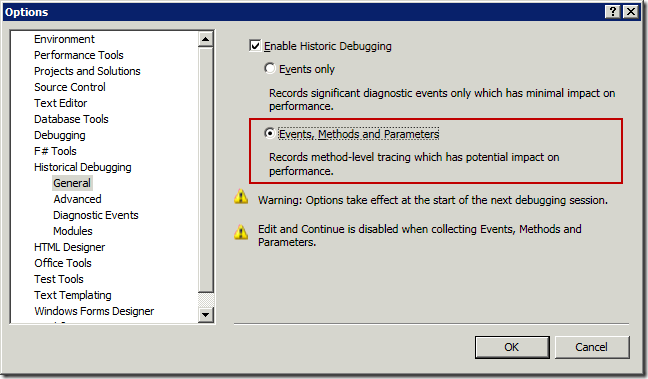
By default, the Playback functionality of the Historical Debugger is disabled. The first step to enable it via Tools.Options.Historical Debugging as shown below. By default, the "Events only" radio button is selected. In order to enable the Playback functionality, select the "Events, Methods and Parameters" radio button. When you select this option, Visual Studio warns you about a couple of issues. First, if you are in the middle of a debugging session, the feature is enabled the next time you start debugging. The other warning is that you can no longer change code and continue debugging once you have this option enabled.

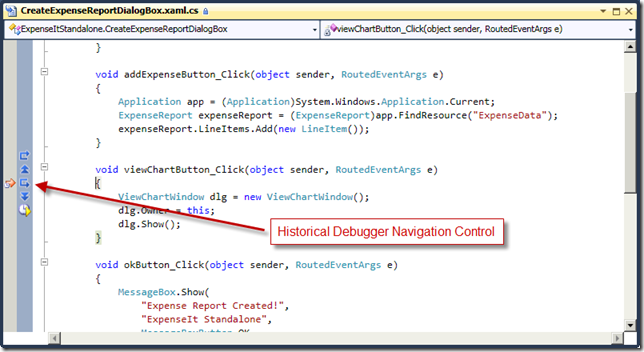
After you have enabled the Playback functionality, you can start the debugger per usual. When you pause in the debugger, you will see a couple of new features. Here again, I’m using the ExpenseIt WPF sample application. The first feature is the Navigation control that allows you to step back out to the previous function call , step back into the next function call, go to next event, go to previous event, Go to live debugging. You can see a screen shot that shows the Navigation Control below. Using the navigation control, you can "time travel" in the debugger.

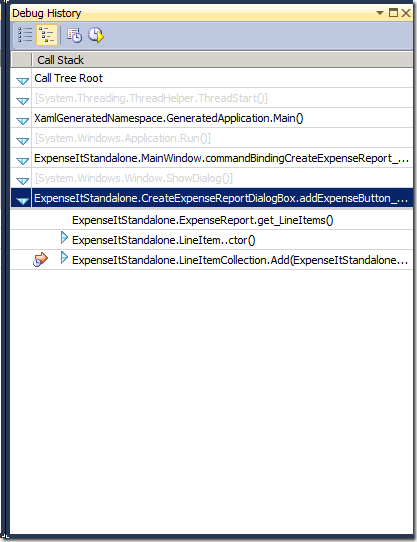
Another feature that gets enabled when you turn on the Playback functionality is the ability to see the exact execution history of your application. It is essentially a tree view that shows you what the methods were called during the execution of your application, all the way from the moment that your application started. Using this view, you can navigate through your application and look at what happened in the past.

Habib Heydarian.
Comments
- Anonymous
June 10, 2009
In part III of the coverage of the Historical Debugger, I’m going to look at another scenario of the