Enhanced Knowledge Base Usage Analytics with Azure Application Insights and Power BI
When managing a self-service knowledge base, understanding how customers and employees are searching for and consuming self-service knowledge is an important part of ensuring your content remains relevant and useful for end users.
Dynamics includes a number of in-built capabilities to help analyze the usage of the knowledge base, including:
- Tracking of article views by source
- Tracking of article ratings and feedback
- Tracking of case deflections from knowledge
- Tracking of articles associated with, or used in resolving cases
In some instances, we may wish to extend beyond the in-built capabilities, to understand usage patterns to a greater depth: what your users are searching for, which searches are not returning any results, and how users are navigating through your Dynamics portal, for example. These metrics can help you create targeted content to meet the needs of your users.
In this post, we will walk through an example of how we can track and analyze portal-based knowledge base usage patterns in more detail, with Azure Application Insights and Power BI.
We will augment the in-built analytics with reporting on:
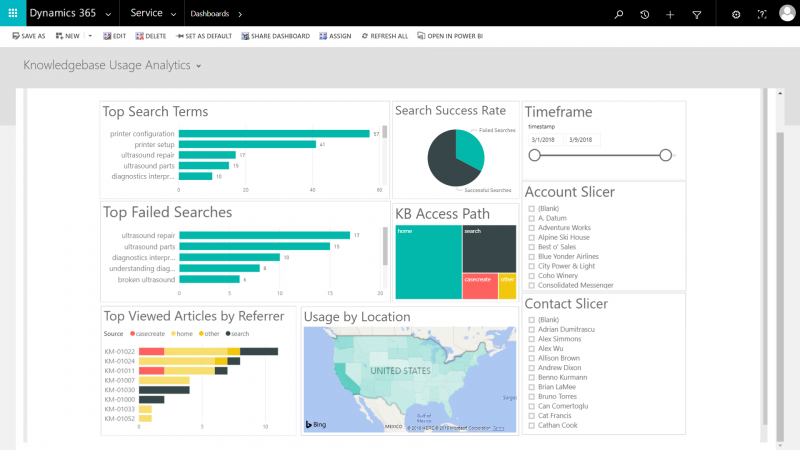
- Search patterns – including top searches and top failed searches
- Article View patterns – including views by user and views by referring page
Our goal will be to empower knowledge managers with a visualization such as this:
Prerequisites
The prerequisites for building and deploying our enhanced analytics include:
- An instance of Dynamics 365 for Customer Service (Online)
- You can request a trial of Dynamics 365 for Customer Service here
- A Dynamics 365 Portal connected to your Dynamics 365 instance
- In this walkthrough, we will use a portal configured with Portal Audience: Customer, and type of portal as Customer Self-service Portal
- A Microsoft Azure subscription for enabling our Application Insights resource
- Power BI Desktop, and a Power BI account, which can be obtained here
Setting Up Application Insights
Azure Application Insights is an extensible Application Performance Management (APM) service that works across multiple platforms. Among its capabilities are the ability to track and understand what users are doing with web applications, to continually improve performance and usability.
We will use it to track and report on specific user actions within the Dynamics 365 portal, leveraging Application Insights for web pages, and the Application Insights SDK JavaScript API.
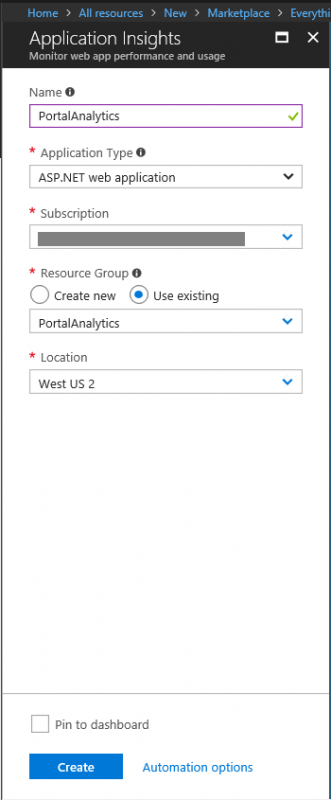
First, we authenticate to the Azure Portal, and create a new Application Insights resource. This link will take us directly to the Application Insights resource creation blade. We complete the required information, specifying the Application Type as ASP.NET Web Application, and click the Create button:
Once the Application Insights resource has finished deploying, navigate to the resource. Scroll down and click the Getting Started button in the resource blade, click MONITOR AND DIAGNOSE CLIENT SIDE APPLICATION, then click to copy the JavaScript code snippet to your clipboard:

In the Dynamics 365 Web Client, we can paste this code into a Content Snippet named Tracking Code, which is suited for this purpose. The code we are pasting includes our Application Insights key. This code will be included in each page that is rendered on our portal, enabling us to track portal usage:
![]()
We will now leverage the Application Insights SDK JavaScript API to track specific events that occur on the portal. Within the JavaScript SDK, we are able to make use of the trackEvent method to log instances of specific user actions, including our own properties that we can specify. We will use this to log user searches, and knowledgebase article page views. We can also ensure that our events are tracked to the specific portal user by setAuthenticatedUserContext method to associate searches and views to individual authenticated portal users.
Tracking Searches
When users search on our portal, we will track what query the user entered when searching, as well as how many results were returned. If we have an authenticated portal user, we will also include that in the context of our event. We do this by editing the default Web Template called Faceted Search – Results Template, which is used to render the results of the search on the portal. The portal leverages Handlebars, the popular JavaScript templating engine, to render the results.
The updated template code below shows demo-grade updates which will register a Handlebars helper JavaScript function called logresults, which can be called from within the Handlebars template, where we have access to the count of search results that are being rendered. The helper will:
- Receive the result count as a parameter (note that we are tracking the number of results across all types; articles, forums, portal pages, etc.)
- Ensure that the count is a numeric value
- Set the authenticated user’s GUID into context, if we have an authenticated user (making use of Liquid templating to inject the authenticated user’s ID)
- Log a custom event named search, with the results count, and the query phrase (also injected vi Liquid) included as custom properties
- Use a counter to ensure that the search event is logged only once per page render, and not logged again on subsequent uses of the search faceting
[snippet slug=faceted-search-results-template line_numbers=false lang=js]
Tracking Article Views
Although Dynamics 365 portals track article views as an in-built capability, we can gain more insight into usage patterns by logging custom events. We can track page views by specific users, track how they arrived at the page (by search vs navigation), and more.
To do this, we will navigate to the portal Web Page called Knowledge Base – Article Details (drill down into the Localized Content for the page, if applicable) and we add some Custom JavaScript to the page, found under the Advanced tab in the default Web Page form.
The following demo-grade JavaScript code will:
- Use a JavaScript regular expression to obtain the Article ID from the page URL (ensure that the pattern used matches your article public number convention)
- Checks the referrer URL against a number of the Site Settings pages that we anticipate article traffic to come from, and setting a source variable accordingly
- Sets the user’s GUID into event context, if the user is authenticated
- Logs a custom event named view, with the articleId and source as parameters
[snippet slug=knowledge-base-article-details-custom-javascript line_numbers=false lang=js]
After saving these changes, we can open up our portal in a browser, and start searching and viewing knowledgebase articles, to generate some data for our reporting and analytics.
Viewing and Exporting the Event Data in Application Insights
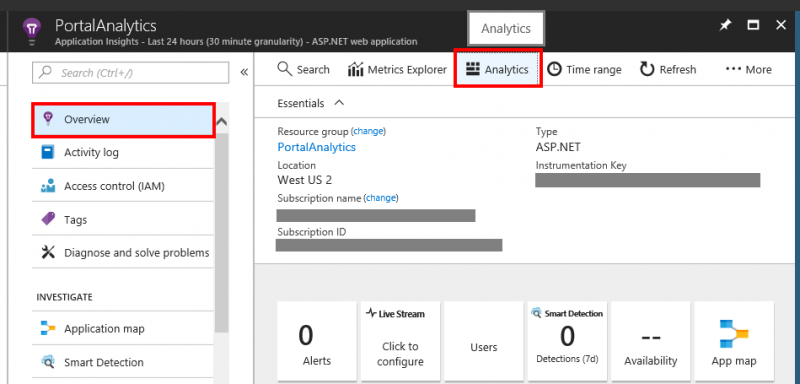
Back in the Azure portal, on our Application Insights resource blade, we navigate to the Overview, which allows us to click the Analytics button to open Analytics:
Analytics is the search and query tool that accompanies Application Insights. It has its own query language, which can be used to run queries against the data. Queries we write can also be used to export data to Power BI.
In Analytics, we open a new tab to query our data, and type in a query that will return all of our search events. Note how we retrieve the query term and result count from our custom parameters:
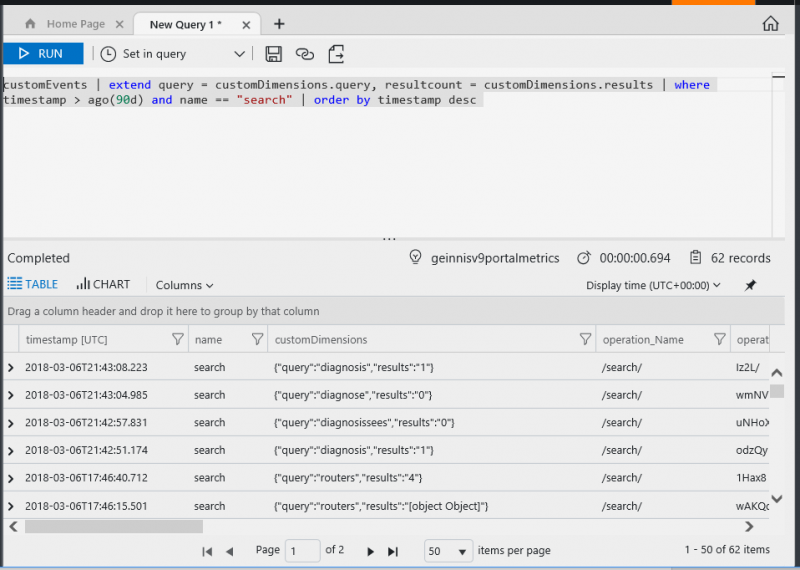
Note that we also retrieve all data from the last 90 days. Application Insights stores analytics data for up to 90 days. If we wish to report on usage patterns going back further than 90 days, we could make use of the Continuous Export feature of Application Insights to export the data to a storage account, and into SQL Azure for continued availability in our analytics reports (not covered in this post) .
We will now export the query for use in Power BI, by selecting Export to Power BI from the Export menu:

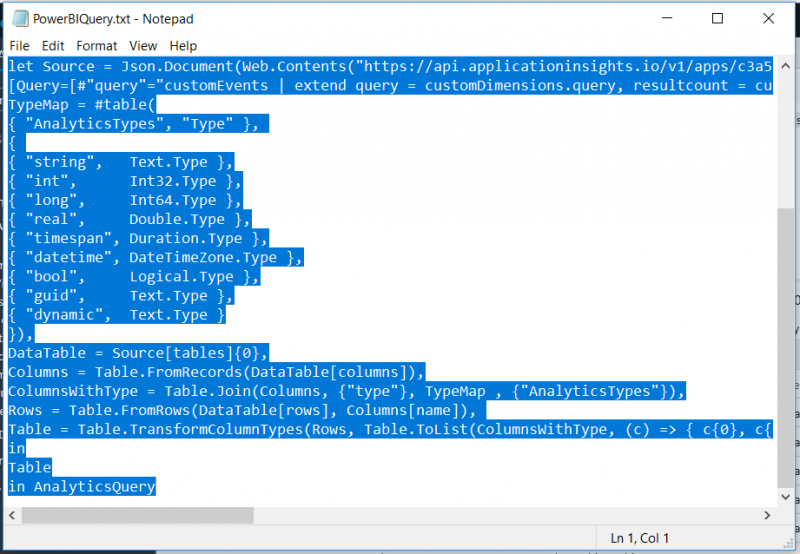
We will be prompted to open or save the text-based exported query. We can open and then copy the query to our clipboard, for use in Power BI:
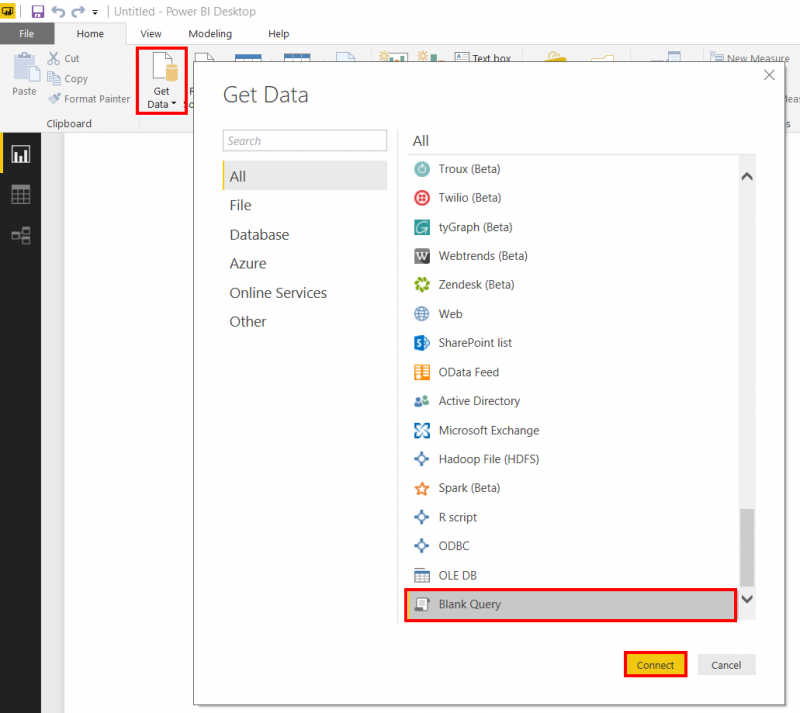
We then open Power BI Desktop, and click the Get Data button, and choose Blank Query:
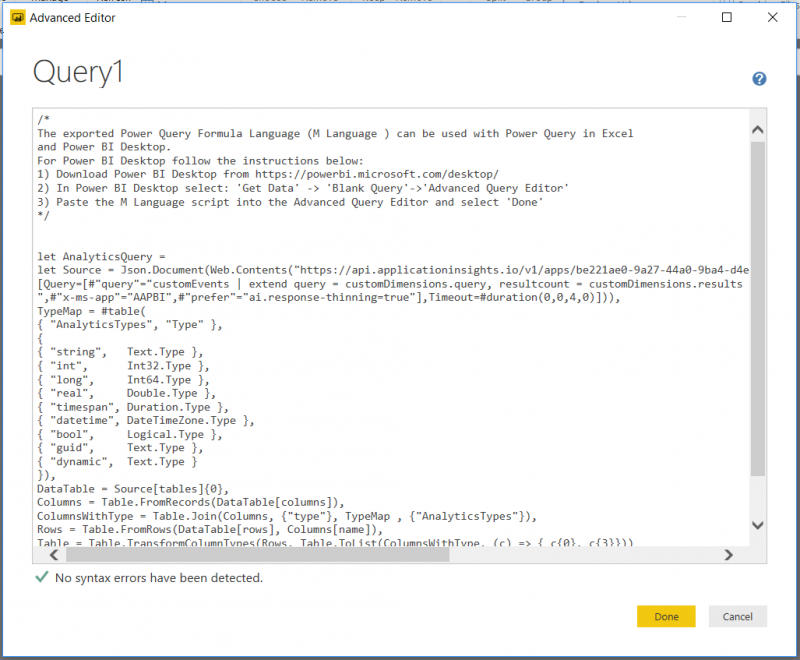
We insert our search query, and click the Done button:
We can repeat these steps for our article view query, using the following query syntax:
customEvents | extend source = customDimensions.src, id = customDimensions.id | where timestamp > ago(90d) and name == "view" | order by timestamp desc
Building our Power BI Dashboard
We can now start building a dashboard in Power BI to help us visualize and understand knowledgebase usage trends.
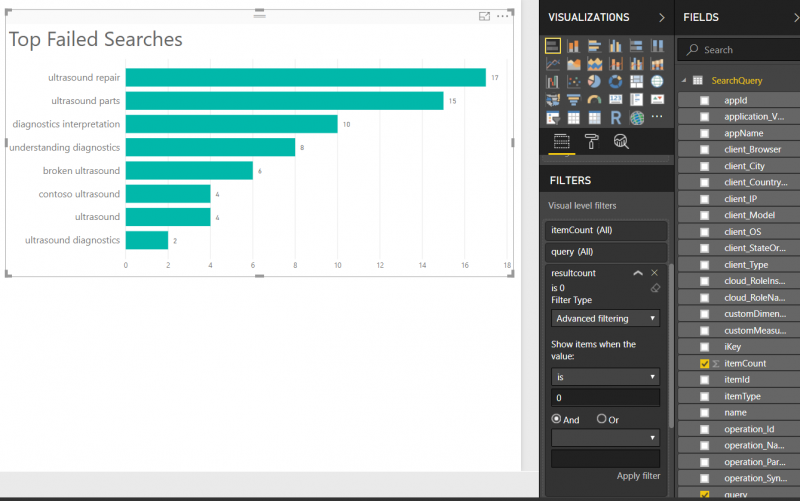
For example, we can use our Search Query data in a Bar Chart visualization, selecting itemCount and query, with a filter in which resultcount is equal to 0, to create a visualization of top failed searches:
We can continue to build out a dashboard, creating visualizations that will help us understand our users’ search and article viewing patterns, using attributes such as authenticated user, timestamp, user location, and more. We can also pull data from Dynamics 365 into Power BI to augment our visualizations further:

Finally, we can use the process outlined here to embed our dashboard in Dynamics 365:

We can now analyze the patterns of usage in our knowledge base on an ongoing basis, to make informed decisions about how best to augment our knowledge, and how to optimize our end-users' self-service experiences.
These same techniques can be extended to track and analyze many other aspects of user behavior on Dynamics 365 portals as well.