UAG Activity Logging
When you connect an application through UAG, all the user activity will be logged by the system. The reason is that it is not only a “technical” gateway (that will pass back and forth the HTTP requests), but an “application layer” one (that will also inspect and provide security).
In this post, I would like to show you different ways to see this logging.
The scenario
In order to show you the different ways to see this activity, I will use a very basic scenario:
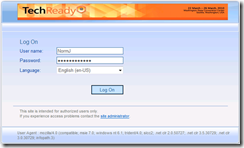
1) I try to authenticate with a “NormJ”, but this user do not exist in my AD, so authentication fails.
2) I successfully authenticate with “administrator”.
3) I launch OWA.
4) I try to send a mail with an attachment, but because my AV is stopped, UAG blocks the “attachment” attempt.
This blog post is linked to a presentation I had the pleasure to co-present (with Oleg), at Microsoft Tech Ready event in Seattle in March.
UAG Web Monitor
Web monitor is a web application that comes with UAG. With this program, you can both see “real time” activity and also history.
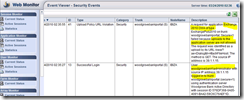
In the scenario I am running for this post, the first thing I am doing is connecting with a user that does not exist in the AD. In return I get an error message of course as a user. Here is the vision in Web Monitor:
As you can see an error is raised (ID 14) providing the IP of the machine, the user used, and the reason of the problem. In fact Web Monitor “reads” the logs written by UAG on the local machine.
In this next part of the scenario, I successfully authenticated (with administrator, bottom of the screenshot). But, we have now another event, because I tried to UPLOAD a document (attach a file in OWA) with my AV stopped (I stopped my AV for the demo of course). UAG identified that risk, and block this attempt.
Note that in these logs you have both the “IP” of the machine, but also the “name” of the user. After authentication take place, all user activity is traced at “user level”. You can then track what each user is doing.
So far we used WebMonitor that will read the local logs. Let’s see how we can enhance that, and ask the machine to send all these events in a SQL database rather than storing that locally. Could be the local SQL (installed by TMG for local logs) or an external server where you want to consolidate those events, and user reporting services to generate reports.
Sending events in SQL
As soon as you have more than one machine, and a lot of connections, you may want to send all this very interesting data in an external SQL database. First because information will be out of the UAG machine itself, second because you can consolidate all this data and get interesting reports.
Since in the SQL database you will have all “network” activity (sent by TMG, acting as the Firewall of the machine) and “application/user” activity (sent by UAG), you can analyze this data with different angles, and so go very deep in security.
To configure UAG to log in SQL, check this link: https://technet.microsoft.com/en-us/library/dd897065.aspx
Note : As I am writing this article, this link contains some errors :
· The command line to activate this configuration is MonitorMgrUtil –ssl 1(not MonitorMgrUtil –setsqllogging 1)
· Once this config is set and activated (make sure Monitor says that config is applied), you need to start/stop a service. The service name is “Microsoft Forefront UAG Configuration Manager”
· This service has some dependencies. So either you reboot the machine, or you need to restart also those services :
1) Remote Desktop Gateway B
2) Microsoft Forefront UAG File Sharing
3) World Wide Web Publishing Service
4) Routing and Remote Access
At this level SQL logging is activated. UAG will in fact call a “TMG API” to send those events in SQL. UAG will leverage the TMG code in this area, and as a result of this, SQL will have both TMG and UAG logs in the same place.
Sending events in SQL
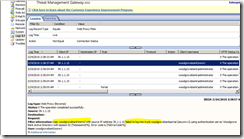
In TMG console, go in the « logs and reporting » section. You can then update the filter (in the logging tab) and just select “log record type EQUAL web proxy filter”. This will reduce the number of event you get in the screen, in this case only “Web”, which means on a UAG machine “only UAG Web traffic”.
Let’s replay the same scenario.
Here is the bad “NormJ” login attempt:
This is the authentication of administrator:
This is the event raised when administrator launched « OWA »:
This is the event you get when a user is trying to do « something » that requires to be compliant with a security policy. In this example, send an attachment (so kind of UPLOAD) and AV is stopped.
Conclusion
In UAG there are several ways to send and use those events. We have seen local logs (and use WebMonitor to read them), SQL logging, but of course we support other repositories such as syslog.
There is also a Microsoft SCOM agent that will be able to gather and use those data, mainly for SLA purposed.
The power of UAG in this area is that we concentrate - in one single point - both “network” and “application/user” data. This means that reports can correlate information from different angles. Usually security specialists investigate the network layer but now they will have the ability to also look at the application layer also.


