DebugDiag - Point&Click debugging adventures made easy
It's been a while since my last blog post. My family and me have been moving to Munich all together and I was busy doing heavy work lifting boxes filled with books and dishes etc...
Further I attended a nice little conference session about the future of MS C++ which I plan to cover in a later bog post.
Besides that I'm working on a couple of exciting service request cases where I applied some of the tools I listed in an earlier post.
Today I'll cover a quick start into DebugDiag which is a tool that I really like because it does not only help you to collect data but also helps you analyze and understand the content.
Assume you have an application that sproradically throws exceptions and thus crashes and you have no idea how to figure out a reason because there is no sources available and it is running in production...
So download, install and run DebugDiag and make sure to get version 1.2.
First thing you should always do with debug tools: get your symbol setup straight:
In most cases the string should read as follows: SRV*c:\websymbols*https://msdl.microsoft.com/download/symbols
If you need to add more, custom symbol folders just add it behind and insert a ";" as in: SRV*c:\websymbols*https://msdl.microsoft.com/download/symbols;C:\\MySymbols
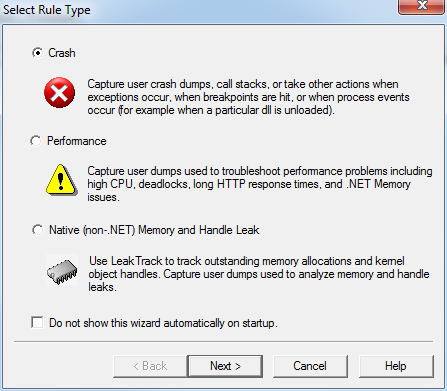
Now you can create a new rule which will be a crash rule as we want to dump in exceptions:
When selecting a specific process you can pick from the list of active processes or type the name of the process you would like to analyze (even if it does not currently run)!
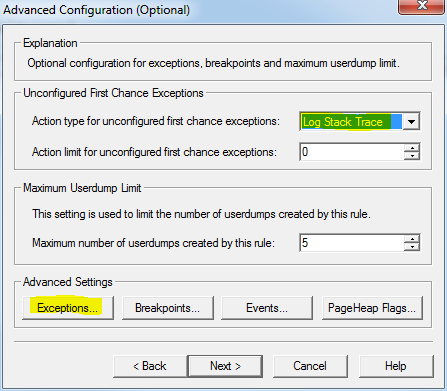
When looking for exceptions in applications it might help logging at least the call stack whenever a first chance exception (fcex) occurs.
First chances are exceptions that get caught during run time and do not cause the process the crash.
If you are one of those rarely seen developers using exceptions in the regular control flow (extensively), you should avoid to set this option :-)
Choose CLR Exception Code from the left hand side list and specify a specific Exception Type Name in the right hand side text box.
Choose Full Userdump as the action type to perform when an exceptions occurs.
If you are interested in the dump of the 4th or so occurence, you may set the action limit appropriately (4).
Once a data file is available (due to a rule or when selecting one manual) you can select an analysis rule to be applied.

What’s nice about DebugDiag is that it works with dumps made with any kind of tool and vice versa so you can load other dumps in or analyze yourself with WinDbg.
You'll be shown an HTML report with results along with some advisory where appropriately.
Sometimes it just points with the finger to the root case of a problem.... God Luck!


