Mashups and visualizations over Big Data and Azure HDInsight using Data Explorer
With the recent announcement about Azure HDInsight, now is a good time to look at how one might use Data Explorer to connect to data sitting in Windows Azure HDInsight.
As you might be aware, HDInsight is Microsoft’s own offering of Hadoop as a service. In this example, we are going to look at how data can be consumed from HDInsight. We will be using a dataset in HDInsight that contains historical stock prices for all stocks traded on the NYSE between 1970 and 2010. While this dataset is not too big compared to “Big Data” standards, it does represent many of the challenges posed by big data as far as end user consumption goes. In case you are interested in trying this yourself, the source of this data is Infochimps. You will need to get the data into an Azure Blob Storage account that is associated with your HDInsight cluster.
The goal of this post is to show you how to use this data to build a report of those stocks that are traded on the NYSE and are part of the S&P 500 index. This dataset by alone isn’t enough, because all it provides is price and volume information by stock symbol and date. So we will need to ultimately find company name/sector information from another dataset. More on that later.
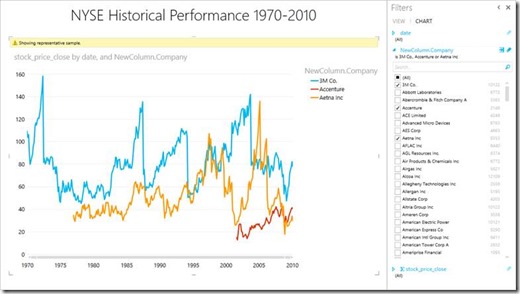
Here’s a view of the report we are attempting to build:
The steps below show you how to build this interactive report.
Step 1: Connect to HDInsight and shape the data
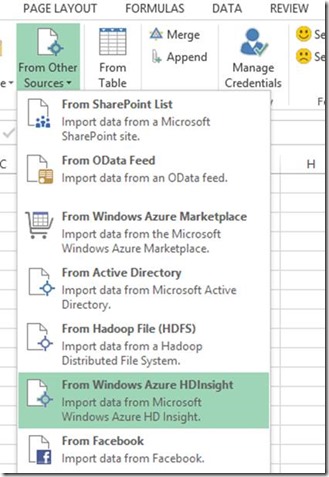
The first step is to connect to HDInsight and get the data in the right shape. HDInsight is a supported data source in the Data Explorer ribbon.
If you are following along and don’t see HDInsight in the Other Sources dropdown, you need to get the latest update for Data Explorer.
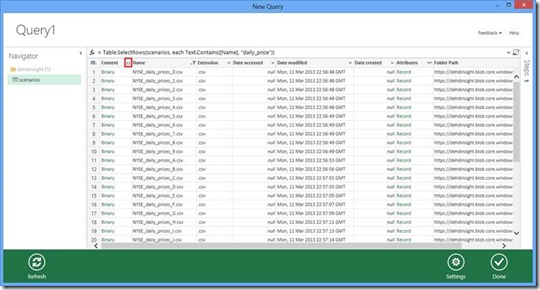
Once the account details are provided, we will eventually be connected up to the HDFS filesystem view:
At this point, you will likely notice the first challenge. The data that we want to consume is scattered across dozens of files – and we absolutely need the data from all of these files. However, this is an easy problem for Data Explorer.
As a first step, we need to use Data Explorer to subset the files based on a condition, so that all unnecessary files are filtered out. We can use a condition that filters down to the list of files that contain “daily_price” in the filename.
After this step, we have just the files needed. Now for the magic.
Data Explorer has a really cool feature that lets you create a logical table out of multiple text files. You can “combine” multiple files in a filesystem view by simply clicking on the Combine icon in the Content column header.
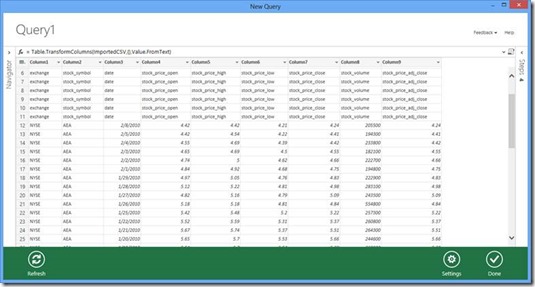
Clicking on that icon produces this:
At this point, one of the top rows can be promoted as header using the feature Data Explorer provides for creating a header row. The rest of the header rows can be filtered out also using the filter capabilities.
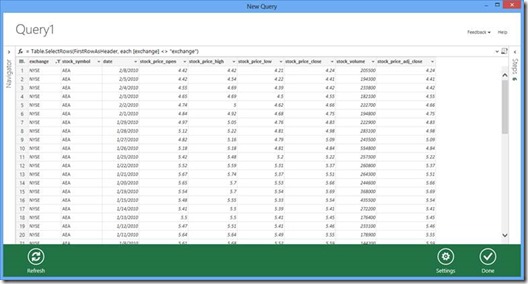
A few more operations to hide unwanted columns will produce our final view:
Clicking on Done will start to run the query and stream the data down into Excel.
Step 2: Find the S&P 500 list of companies along with company information
At this point, the data should be streaming down into Excel. There is quite a bit of data that will find its way down into Excel. However, since we are not done with data shaping, we need to toggle a setting that will disable evaluation/download of the results for this particular query.
Clicking on Enable Download stops the download:
In order to fully build out the report, the next thing we need is the list of companies that are part of the S&P 500 index. We can try to find this in Data Explorer’s Online Search.
Searching for S&P 500 yields a few results:
The first one looks pretty close to the data we need. So we can import that into Excel by clicking Use:
Step 3: Merging the two tables, and subsetting to the S&P 500 price data
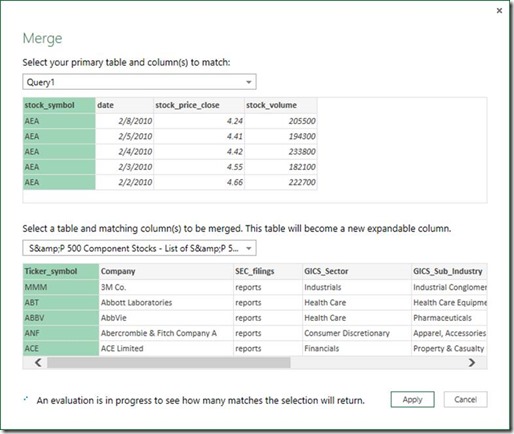
The last step in our scenario is to combine the two tables using Data Explorer. We can do this by clicking on the Merge button in the Data Explorer ribbon:
The Merge dialog lets us pick the tables we’d like to merge, along with the common columns between the two tables so that Data Explorer can do a join. Note that a left outer join is used when merging is done this way.
Clicking on Apply completes the merge, and we are presented with a resulting table:
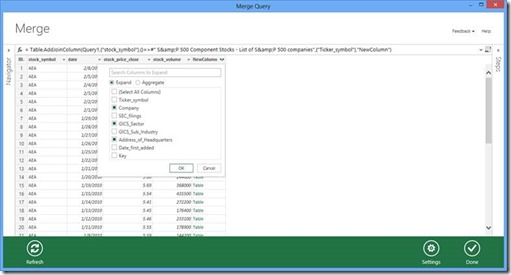
Columns from the second table can be added by expanding and looking up columns from the NewColumn column:
The result of selecting the columns we’d like to add to the table produces this:
Note that there are many columns that have null values for the new columns. This is expected as we have more companies in the left table (the one we pulled from HDInsight).
A simple filtering out of nulls fixes the problem, and leaves us with what we need:
We are now left with the historical end of day figures for all companies in the S&P 500. Clicking on Done will now bring the data into Excel.
Step 4: Fix up a few types in PowerPivot and visualize in Power View
Once the data is downloaded, adding it to Excel’s data model (xVelocity) is easy. Clicking on the Load to data model link puts the data into the model in one click:
Once the data is in the data model, it can easily be modeled using Excel’s PowerPivot functionality.
In order for the visualization to work correctly, we need to adjust the types of the following columns in PowerPivot:
- date – this column needs to be converted to Date type
- stock_price_close – this column needs to be converted to Decimal type
Once this is done, adding the visualization via Power View is easy.
- We can insert a Power View from the Insert ribbon/tab in Excel.
- Delete any default visualizations. From the table named Query in the Power View fields list, select the following columns:
- date
- stock_price_close
- NewColumn.Company
- Change the visualization to a Line chart.
This will produce a visualization that shows all the companies on a single chart. We can then customize the chart and see just the companies we are interested in.
That’s all it takes to get all that data from HDInsight, and to combine that data with some publicly available information. Data Explorer’s Online Search is a good source for public data.
We hope this gives you an idea for how Data Explorer enables richer connectivity, discovery and data shaping scenarios while enhancing your Self Service BI experience in Excel. An interesting thought exercise will be to consider how you might accomplish this scenario without using Data Explorer.
Let us know what you think!
Data Explorer Team
Comments
Anonymous
March 20, 2013
Very nice write-up, thanks. All this seems very very interesting. Can't wait to try it out myself.Anonymous
March 21, 2013
Thanks, Koen. Looking forward to your feedback!Anonymous
March 26, 2013
Please show how stock price splits are handled.Anonymous
May 13, 2013
Great article. Couple comments though
- I really wish the images shown in this blog were crisp to read, they are so blurred right now
- In Step-1, after 2nd image you mentioned "The data that we want to consume is scattered across dozens of files – and we absolutely need the data from all of these files. " If you could highlight how & where we see those "dozens of files" in excel that might be helpful
Anonymous
May 14, 2013
Hi Prasanna, Thanks for the feedback. We will make sure to improve the quality of the images in future blog posts. Regarding where this scenario might be useful, a classical example would be dealing with multiple semi-structured files (such as text logs) where you want to treat them as a single logical view. For instance, if a new file gets dropped every week, you could just use "From Folder" and "Combine Binaries" as described in this post, to be able to refresh the query and retrieve the new rows in the final table, that is constructed based on all files that meet a particular condition (in this post it is about filtering by file name contains a given text, but more sophisticated filters could be defined in Data Explorer for the folder view just as with any other table in the query editor, such as file extensions, or date modified is newer than a certain date, etc.). Thanks, M.Anonymous
May 14, 2013
Hi Kevin, There's actually no split operation on the stock price columns in this scenario. Please let us know what you would like to learn about Split. You can currently right-click on a text column header and use Split Column... by delimiter or number of characters. Thanks, M.
