NGen: Measuring Warm Startup Performance with Xperf
This is article 2 of 4 in the NGen: Walkthrough Series .
This article is part of a series of blog posts intended to help managed code developers analyze if Native Image Generation (NGen) technology provides benefit to their application/library. NGen refers to the process of pre-compiling Microsoft® Intermediate Language (MSIL) executables into machine code prior to execution time.
Startup time is defined as the time it takes for an application from launch to startup such that it is now responsive to user input. It is typically thought of as having two variants, cold startup and warm startup. The time it takes for an application to start up on a machine that has just been booted is typically referred to as cold startup time. The time it takes for the application to start up on its second launch is referred to as warm startup time. The difference between the two is that cold startup time is bound by the need to fetch pages used by the application from disk. In contrast, warm startup is typically only bound by the work the application (and underlying runtime layer) needs to do to start up, since the pages needed by the application under normal circumstances don’t need to be fetched from disk.
Using native images does not necessarily shorten cold startup time since the native image files are significantly larger than their corresponding IL files and may take longer to pull from the disk. We will not talk about cold startup time in this article although that may be a topic we address in a future post. Loading native images however, can help shorten application warm startup time since the CLR does not need to run the JIT compiler on the managed assemblies at application launch time. This article is a walk through to help developers use publicly available tools to evaluate how much warm startup benefit the application will see if NGen were to be used.
We will look at two contrasting scenarios to measure warm startup time, the first will involve an application where most of the managed assemblies being loaded have native images and the second one will involve the same application where most of the managed assemblies will NOT have native images.
Further Reading
1> Performance Benefits of NGen: https://msdn.microsoft.com/en-us/magazine/cc163610.aspx
2> A model for cold startup time: https://blogs.msdn.com/vancem/archive/2007/04/09/a-model-for-cold-startup-time-of-an-application-on-windows.aspx
Getting Started with Xperf
Download Windows SDK: https://msdn.microsoft.com/en-us/performance/cc825801.aspx
Xperf is an ETW based performance measurement tool for Windows that is available publicly. This tool enables drill down analysis into how much machine-wide CPU time was spent in modules of an application.
After downloading Xperf, you can get access to the tool by launching All Programs -> Windows SDK -> Command Prompt. This will place Xperf on the path in the Command Prompt window.
Further Reading
1> Event Tracing for Windows (ETW): https://msdn.microsoft.com/en-us/magazine/cc163437.aspx
2> Additional Information on Xperf: https://blogs.msdn.com/pigscanfly/archive/2008/02/09/xperf-a-new-tool-in-the-windows-sdk.aspx
Warm Startup Time with Native Images
In order to illustrate the analysis of startup performance, we will use a well known large application that has components written in managed code that have native images; Visual Studio 2010. The scenario will launch a basic HelloWorld WPF application in Visual Studio 2010, wait till the UI is responsive, and shutdown. In order to collect CPU time traces for later analysis, Xperf will be used to enable tracing before application launch, and tracing will be stopped after the scenario is run.
The steps below outline the sequence of actions needed.
1> Enable ETW tracing using Xperf
xperf -on base+cswitch
(Starts a trace with BASE Kernel Group and Context Switch Kernel Flag)
2> Run scenario of interest
“C:\Program Files\Microsoft Visual Studio 10.0\Common7\IDE\devenv.exe" "c:\users\xyz\documents\visual studio 2010\Projects\WpfApplication1\WpfApp1.sln"
3> Disable ETW tracing (data is saved to an ETL trace file) using Xperf
xperf -d trace4.etl
4> View CPU time results using Xperfview
xperf trace4.etl
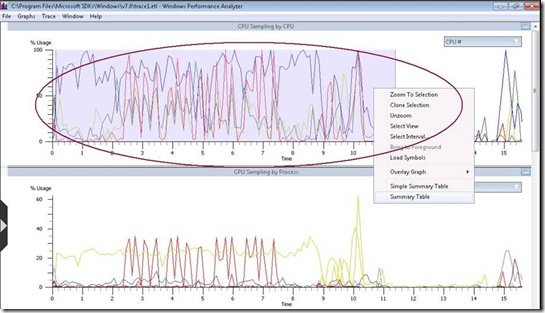
In the last step Xperf will forward the request to Performance Analyzer which will open and display a graphical view of the data in the file, similar to what is shown below.
Screenshot 1: Windows Performance Analyzer
Performance Analyzer has several rows of graphical data, the one of interest to us is the row titled CPU Sampling by CPU. Select the high activity region on the graph (assuming that devenv.exe was the only large application launched during this time-frame, the spikes seen in the CPU utilization should be easy to spot), right click in the region and select the Summary Table item. (Alternatively, you can also look at the CPU Sampling by Process row, and in the Processes drop down menu, you can select only devenv.exe to see the activity for that process.)
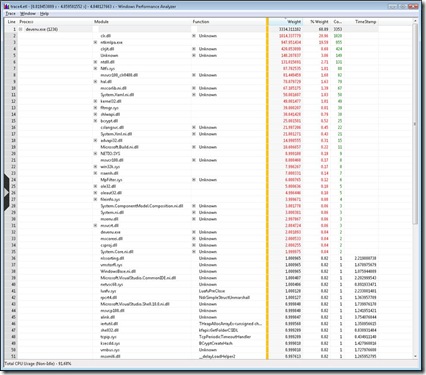
The Summary Table has tabular CPU utilization data for all the processes running on the machine in that time window; devenv.exe should be part of this list. Under the % Weight column you will see the time taken by devenv.exe on the machine as a percentage of the total CPU utilization on the machine.
Expanding the devenv.exe process displays a view of the percentage of CPU time spent in each module loaded within this application. Notice in Screenshot 2 below that the bulk of the time was spent in clr.dll (20.96% total across the machine, which means that it was ~30% of the time spent within the process devenv.exe) and clrjit.dll (8.68% total across the machine, which means that it was ~12.6% within the process). Note that some time was spent in the JIT even though most of this scenario was running using native images. The use of native images can be seen in the fact that *.ni.dll files are listed in the module list (mscorlib.ni.dll, system.xaml.ni.dll etc).
Screenshot 2: Windows Performance Analyzer, CPU Utilization Summary Table drilldown with native images present
Further Reading
1> Detailed guidance on using Performance Analyzer: All Programs -> Windows Performance Toolkit -> Windows Performance Toolkit Help. Select Quick Start Guide: WPF Basics -> Detailed Walkthrough.
Warm Startup Time without Native Images
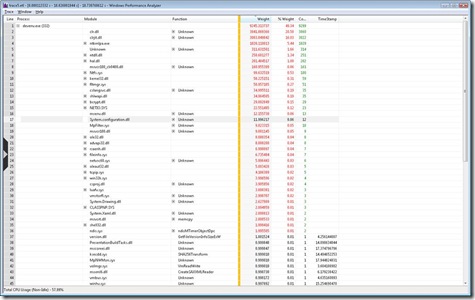
Now let’s turn our attention to what the startup time characteristics look like when native images are not used in the Visual Studio 2010 application. Solely for purposes of this demo, the numbers below were generated by uninstalling all native images for Visual Studio and .Net Framework assemblies. It is NOT recommended that you uninstall native images in general. Executing the sequence of actions used previously, to generate traces again for this scenario, we get the graphs seen below.
The increase in the total CPU utilization by devenv.exe (49.34%) complicates the analysis a tad bit, but we can see that the time spent in clr.dll went up to 20.5% total, which means ~41.5% of the time spent in devenv.exe was spent in clr.dll. This is a large increase from the previous scenario where only 30% of the time spent in devenv.exe was in clr.dll. Furthermore, the time spent in clrjit.dll went up to 16.03% total, which means ~32.5% of the time spent in devenv.exe was spent in clrjit.dll. This is also an increase from the previous scenario where only 12.6% of the time was spent in clrjit.dll, almost a 3x increase! Also note that the list of modules loaded no longer shows modules that end with a .ni.dll file extension, indicating that native images were not loaded.
This large increase in time spent in clr.dll and clrjit.dll is to be expected when native images are not present. Since native code does not exist for many assemblies, the CLR needs to invoke the JIT to compile methods to native code at runtime, explaining the increase in time spent in clrjit.dll. Time spent in clr.dll also increases because the CLR needs to execute code to invoke the JIT, and it needs to create internal data structures that the native code will need.
Screenshot 3: Windows Performance Analyzer, CPU Utilization Summary Table drilldown without native images present
Wrapping it up!
This article demonstrated how to measure an application’s warm startup time using Xperf, and we saw the benefit of using native images for large applications. Hopefully, the information above will help you do a first round of evaluation of whether your managed application/library will benefit from the use of NGen. We’d love to hear what you think! Have you used Xperf before to do similar analysis? What were the pitfalls you ran into? Please use the comments section below for any feedback, questions and tips you’d like to share.
Lakshan Fernando, Pracheeti Nagarkar
CLR CodeGen team


