Debugging Node.js apps on Azure App Services
A large part of software development involves troubleshooting. Logging is one of the mechanisms that is used to make it easier to enables the developers to see what the code is really doing. Therefore, It is necessary to have the proper logging to troubleshoot the issues faster , which otherwise will become nearly impossible to nail down the application issues.
Here, in this article, I will explain how to enable node.js application level logging on Azure App Service(Windows) to visualize the logs that are placed in your code. Azure App services comes in 2 offerings
- App Service Windows
- App Service Linux(Blessed/Custom Images) : Refer to the article here for detailed information of logging on App Service Linux
Enable logging on Windows:
Below are the two ways of achieving it
- Using portal
- Using iisnode.yml file
Using Portal
- Navigate to your webapp from the azure portal
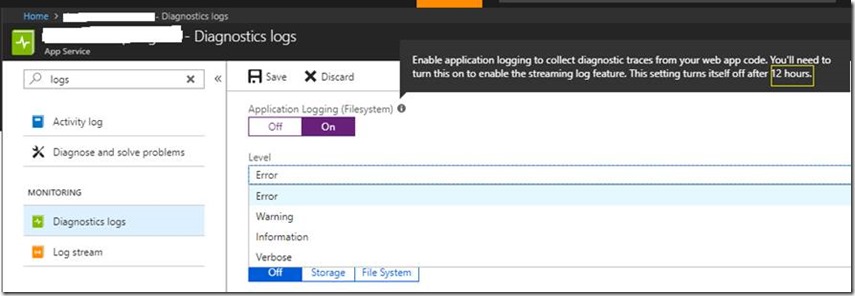
- Choose the Diagnostic Logs blade. For application level logging, You can either choose Filesystem or Blob storage
- Below is the snapshot of the Filesystem option
- Notice that the logging will get turned off automatically after 12 hrs. The reason being you have a limited set of storage you have on the local file system, which will be 1GB - 250GB depending on your App Service Plan (size). This could affect the site performance due to excessive writing to the file system. You also get to choose the logging level here.
- This limitation is not applicable if you choose blob storage option. However, for node.js it is not straight forward to store the logs in the blob storage. Check out the article here to know how to use this option in node.js to store the logs to azure storage.
- Once the above step is done, You can view these logs on your file system by following the steps below
- Go to your file system by browsing https://{webapp_name}.scm.azurewebsites.net (called as kudu site) url
- Click on Debug Console –> cmd –> LogFiles –> Application
- Files of interest here: index.html and logging-errors.txt
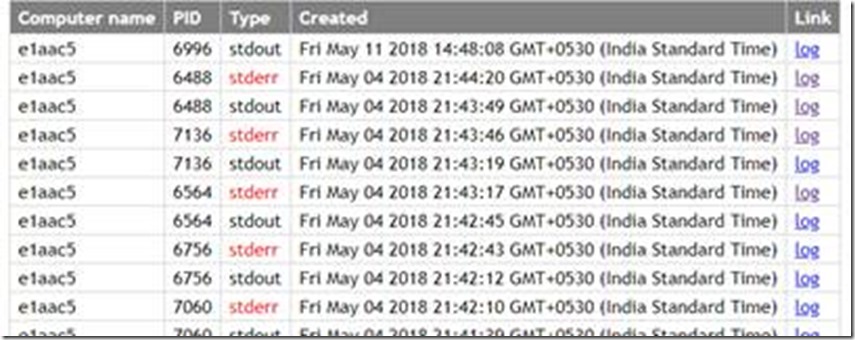
- Click on the download symbol beside the index.html to get a pretty view of the stderr and stdout logging. Below is the screenshot of the same. Once you click on the log link, you will be able to see the details of the message
- The logging-errors.txt captures all the uncaught exceptions that occur at the run time of your application.
Using iisnode.yml
- This option requires you to create a new file called iisnode.yml (This specifies all the configuration at the iisnode level)
- Go to the kudu site of your webapp (https://{webapp_name}.scm.azurewebsites.net)
- Click on Debug Console –> cmd –> site –> wwwroot
- Create a file named iisnode.yml and place the content below
loggingEnabled: true
- Once this is done, you can view the logs again by following the same method as described above in “Using Portal” Section by going to Debug Console –> cmd –> LogFiles –> Application
- Notice that this logging will also be turned off after 12 hrs for the same reason as described above under “Using Portal” section


