Test reports
Important
Visual Studio App Center is scheduled for retirement on March 31, 2025. While you can continue to use Visual Studio App Center until it is fully retired, there are several recommended alternatives that you may consider migrating to.
When your tests execute in App Center Test, we generate reports with a summary and detailed information for
- the test run
- the tests
- the devices.
At the completion of the test run, you can view these reports in the Tests section of App Center.
Read App Center Test Core concepts to understand the terms and concepts used below.
Navigating to test runs
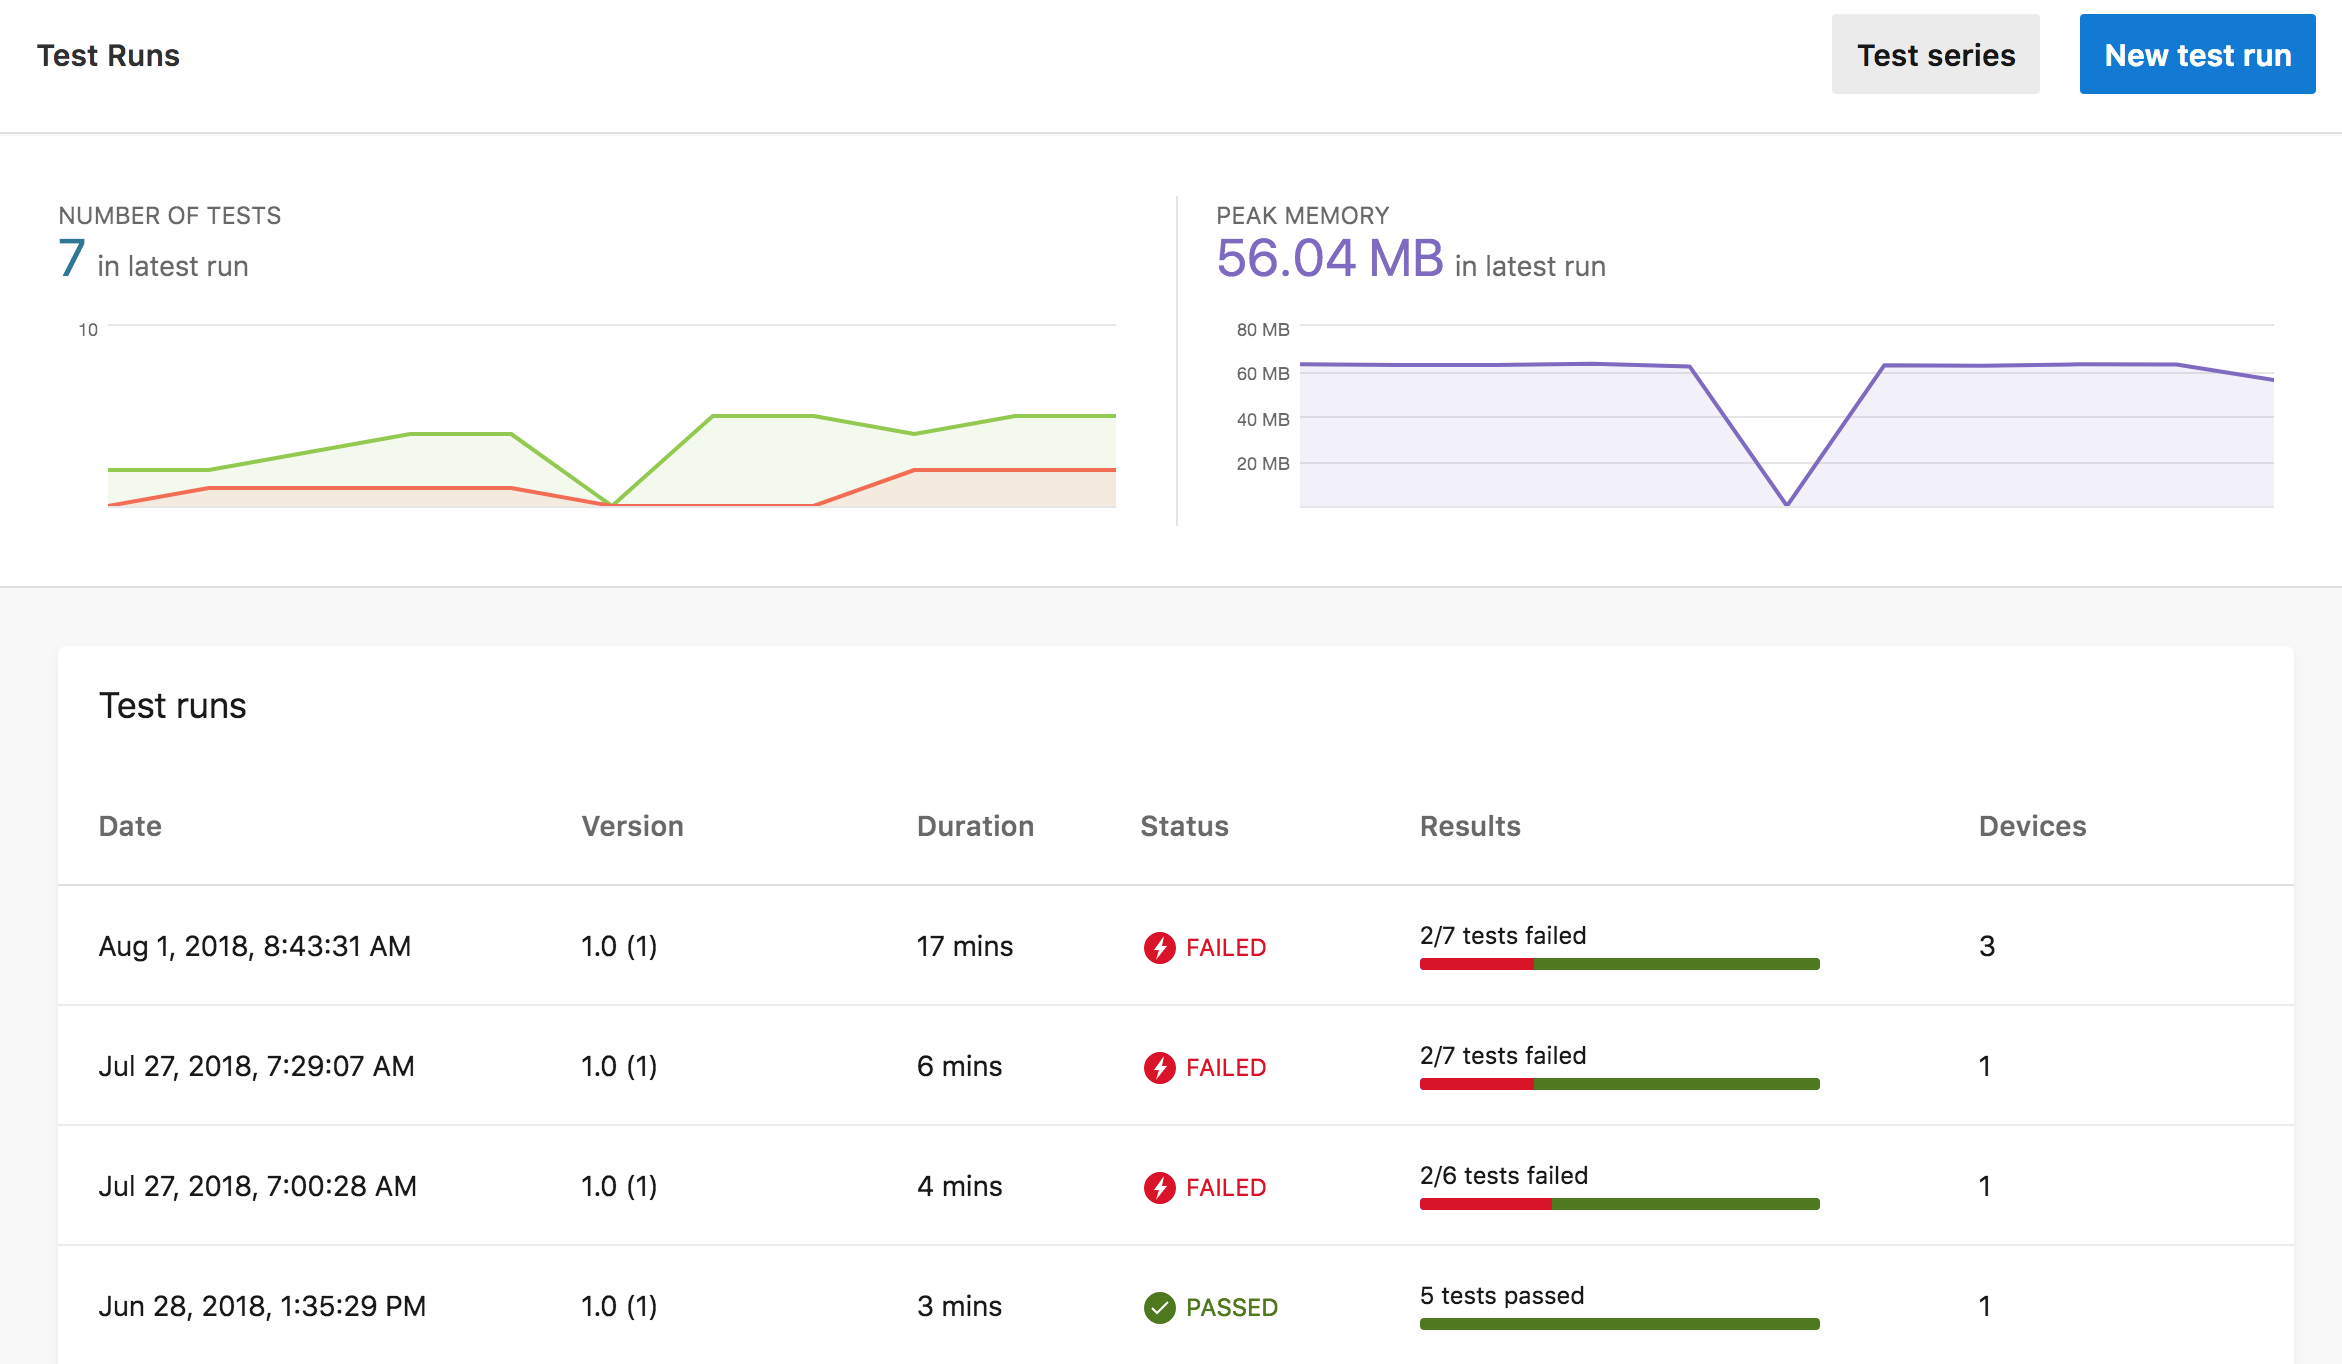
Starting from the App Center My Apps page, select an application, then select Tests in the navigation list. From the Test runs dashboard all test runs in the default test series for that application are displayed.
Test runs dashboard
Note
Only the 50 most recent test runs will be shown for the selected Test Series on the Dashboard.

The color green or a check mark on a green background indicates passing and the color red or a lightning bolt on a red background indicates failing, throughout the test reports.
- The Test series button filters or creates a test series.
- The New test run button starts a wizard that helps you to create a sample command line to submit a new test run.
- The Number of Tests graphic near the top left shows the test run history with the number of tests passed and tests failed. Click in this graph to navigate to a specific test run.
- The Peak Memory graphic at top right shows test run history for the peak memory consumed by the application. Click in this graph to navigate to a specific test run.
- The Test runs list shows summary test run results including Date, Duration, Status, Results, and number of Devices. When filtering by test series, only test runs from the selected test series are shown.
Click on the test run of interest to see the Test run summary page for that test run.
Test run summary

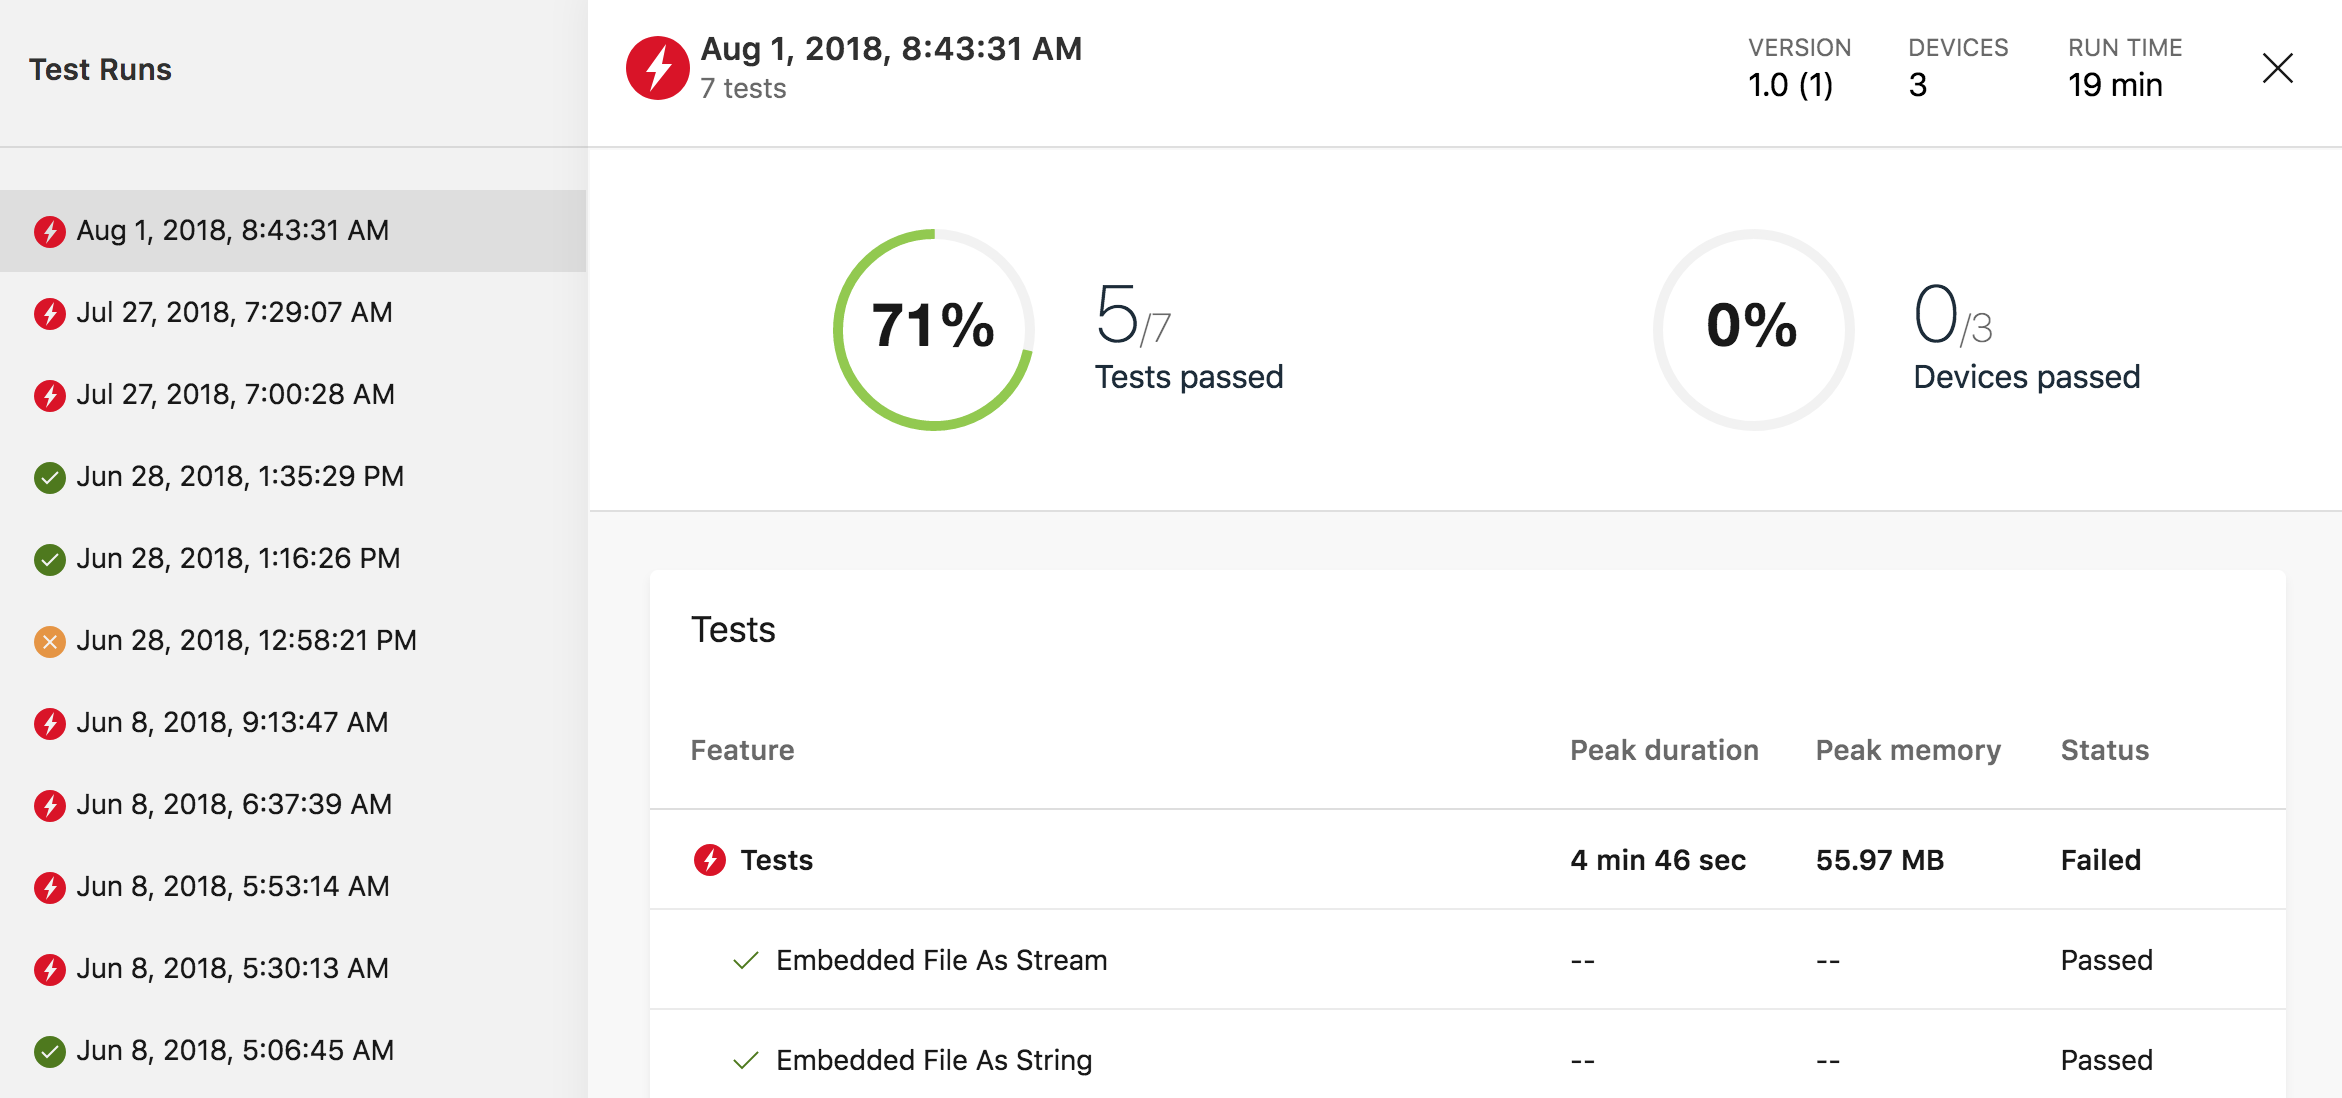
Click in the Test Runs navigation list on the left to view the summary for that test run in the detail pane. The detail pane shows:
- The date and time the test run was submitted.
- The number of Devices in the test run.
- The Run Time for the test run. Run time is the total elapsed time from when the test run was submitted until the final reports are viewable in App Center Test.
- The number of tests in the test run.
- The Tests passed graphic shows the percentage and number of tests that passed. To pass a test, must pass on every device in the test run.
- The Devices passed graphic shows the percentage and number of devices on which all tests passed.
- The Tests list displays the tests in the test run.
Click on a test of interest in the detail pane and either the Test overview page or the Test detail page opens, depending on the number of devices in the test run. If there's one device, App Center opens the Test detail page and if there are multiple devices, App Center opens the Test overview page where you can navigate to a Test detail page for a specific device.
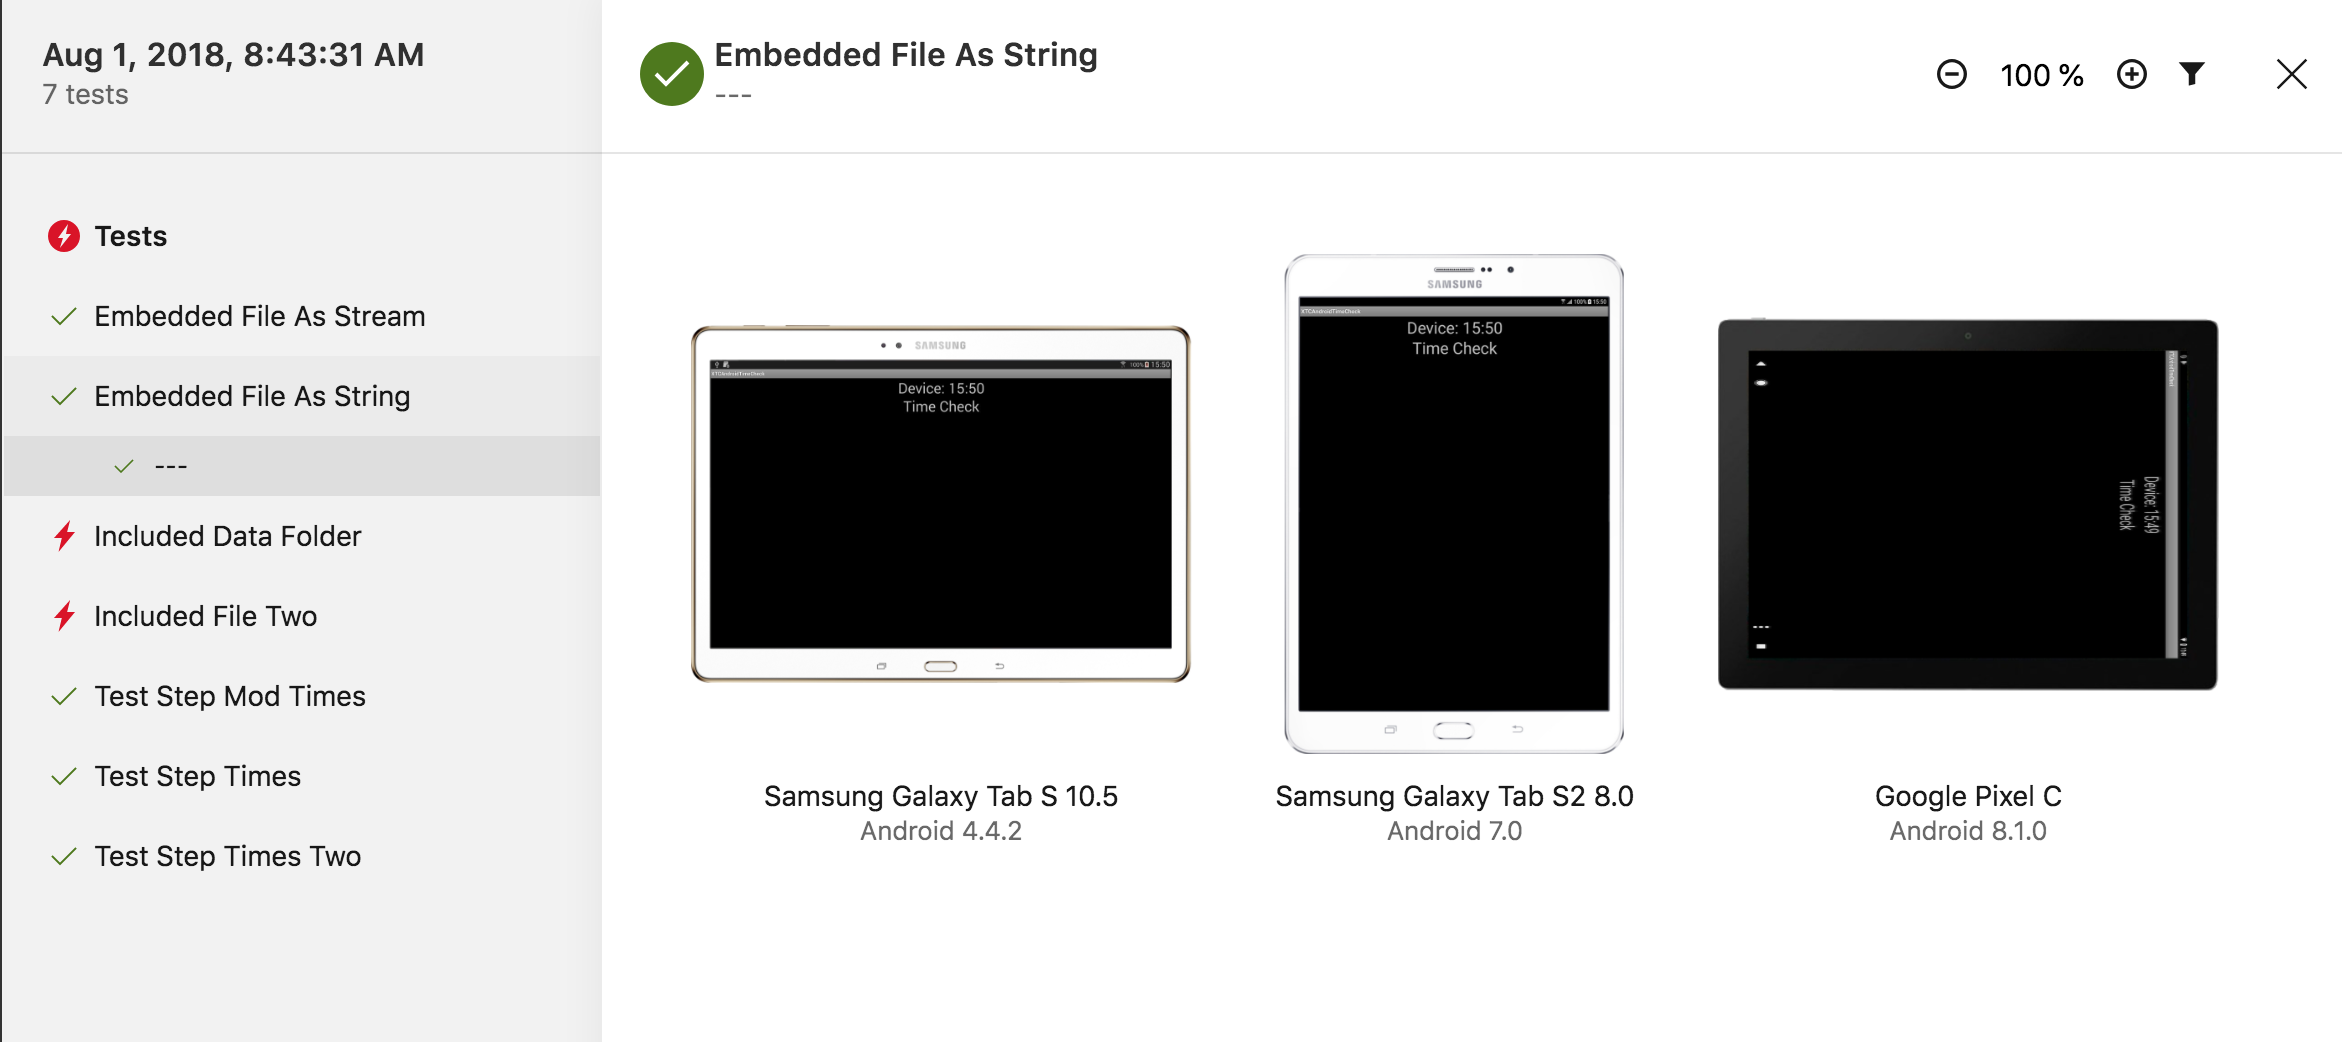
Test overview

This page only displays if there are multiple devices in the test run.
The Tests navigation list on the left shows the test step name or test label. Navigate by clicking in this list or scrolling up and down with the 'k' (up) or 'j' (down) keys.
The detail pane shows screenshots for each of the devices in the test run for the selected test step. The Device and OS version are listed beneath the screenshot. The Filter icon near the top right lets you filter by various device attributes like form factor, cpu, and OS version.
Click on a screenshot to navigate to the Test detail page for that device.
Download the full sized screenshot
To speed up the page rendering, all screenshots are resized to match multiple browser windows sizes. For larger screenshots, the test report automatically renders with the 50% screenshot. The API can be used to download the full sized screenshots by getting the test report https://openapi.appcenter.ms/#/test/test_getTestReport and from the report fetch the step report (step_report_url). Within the step report, there'll be a field called original (/deviceScreenshots/*/screenshot/urls/original) that will point to the full size screenshot.
Follow this link for instructions on how to use App Center's API
Test detail

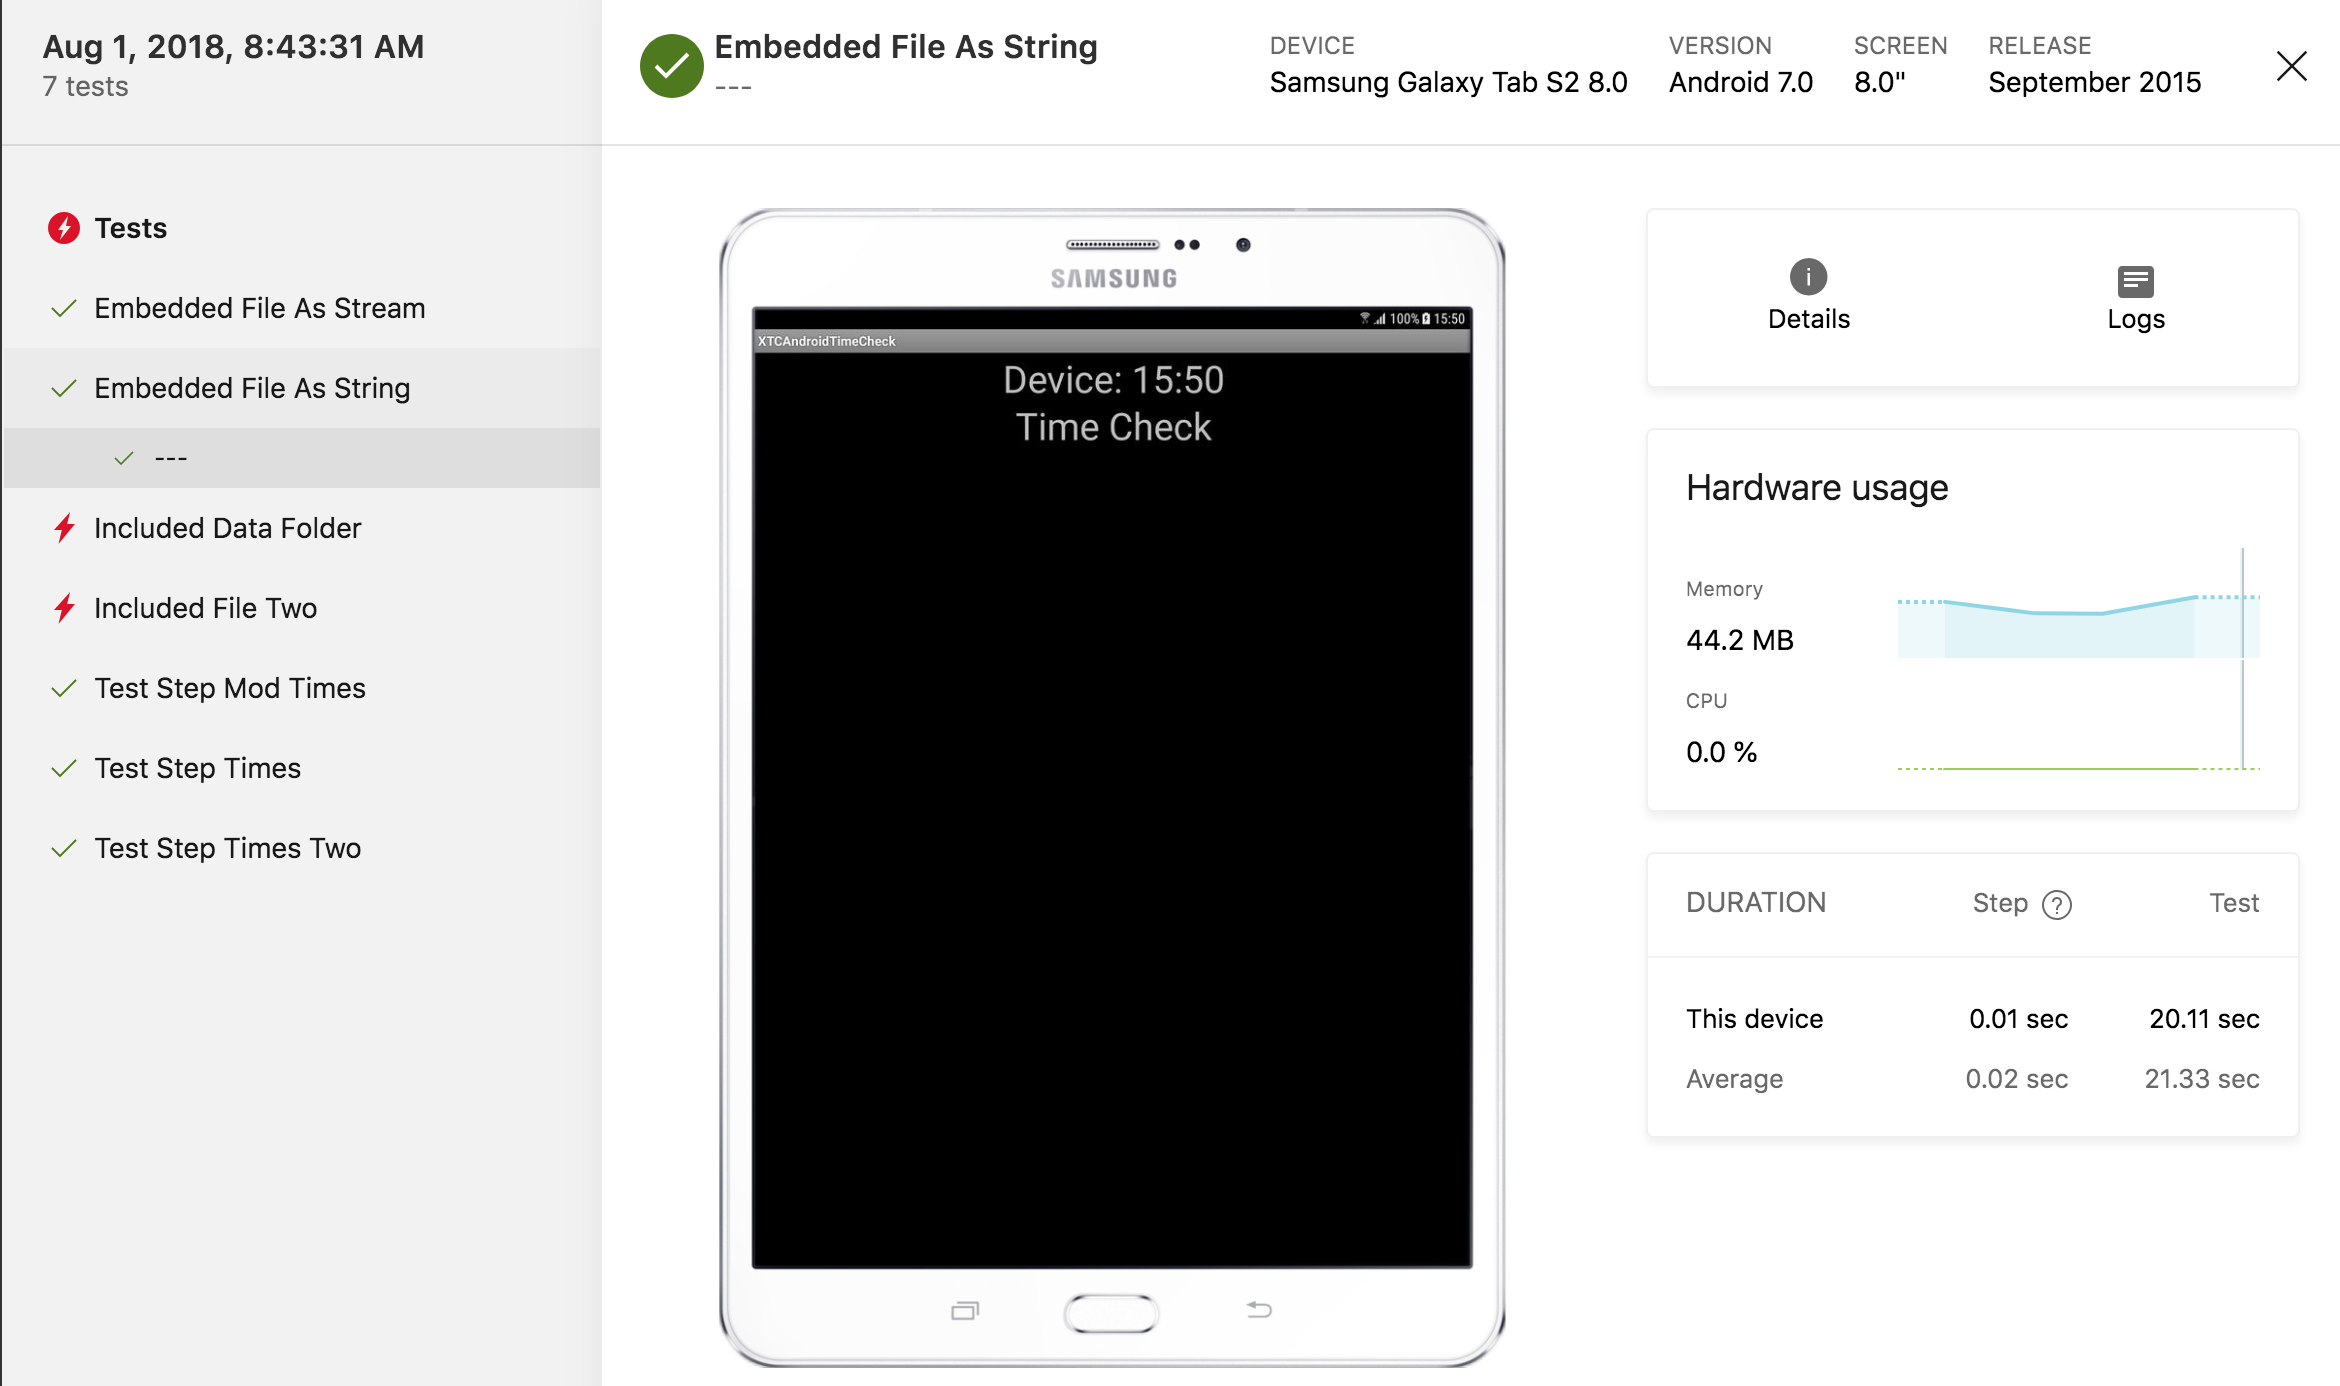
The Tests navigation list on the left shows the test step name or test label. Navigate by clicking in this list or scrolling up and down with the 'k' (up) or 'j' (down) keys.
- The test name, device and os version are listed across the top of the page.
- The screenshot is displayed for the selected device for the selected test step.
- The Details icon displays device information like memory, CPU speed, and dimensions.
- Clicking the Logs icon will navigate to the Test logs page.
- The Hardware usage graph displays the Memory and CPU utilization during the test.
- Duration shows the time to complete this test and test step. The test step time shown here is the test time starting with the displayed screenshot and the selected test step until the following screenshot. It isn't the time ending with this screenshot.
Test logs

The tabs across the top of the page include Test Logs and Device Logs. There may be others depending on the test framework used. A Stack Trace tab will appear if any stack traces were captured for this test run for this device.
Test logs tab
Click the Test Logs tab near the top of the page.
Test logs and framework specific logs are the output from the test framework and provide clues as to why a test failed or issues involving the test framework.
Stack trace tab
Click the Stack Trace tab near the top of the page.
Stack traces are errors captured during the test run. Any stack traces should be examined along with the test logs and device logs for more context to troubleshoot application issues.
On iOS, the stack trace is relevant to any issues with the tests. On Android, if your application code is included in part of the stack trace it's relevant.
Device log tab
Click the Device Logs tab near the top of the page.
The device log is the output from the device during the test run. Click Download device log to access all of the the device log file. When the log file starts loading in your web browser, you can use your web browser to save the file locally and use local tools to examine the log. Saving the file locally will usually be faster for multiple searches or when the device log file is large.
Getting help
You can contact support in the App Center portal. In the upper right corner of screen, select the Help (?) menu, then choose 'Contact support'. Our dedicated support team will respond to your questions.
If you want help with a test run, navigate to the test run in question and copy the URL from your browser and paste it into the support conversation. A test run URL looks like something like https://appcenter.ms/orgs/OrgName/apps/App-Name/test/runs/77a1c67e-2cfb-4bbd-a75a-eb2b4fd0a747.