Integrate CyberArk with Microsoft Defender for IoT
This article helps you learn how to integrate and use CyberArk with Microsoft Defender for IoT.
Defender for IoT delivers ICS and IIoT cybersecurity platforms with ICS-aware threat analytics and machine learning.
Threat actors are using compromised remote access credentials to access critical infrastructure networks via remote desktop and VPN connections. By using trusted connections, this approach easily bypasses any OT perimeter security. Credentials are typically stolen from privileged users, such as control engineers and partner maintenance personnel, who require remote access to perform daily tasks.
The Defender for IoT integration along with CyberARK allows you to:
Reduce OT risks from unauthorized remote access
Provide continuous monitoring and privileged access security for OT
Enhance incident response, threat hunting, and threat modeling
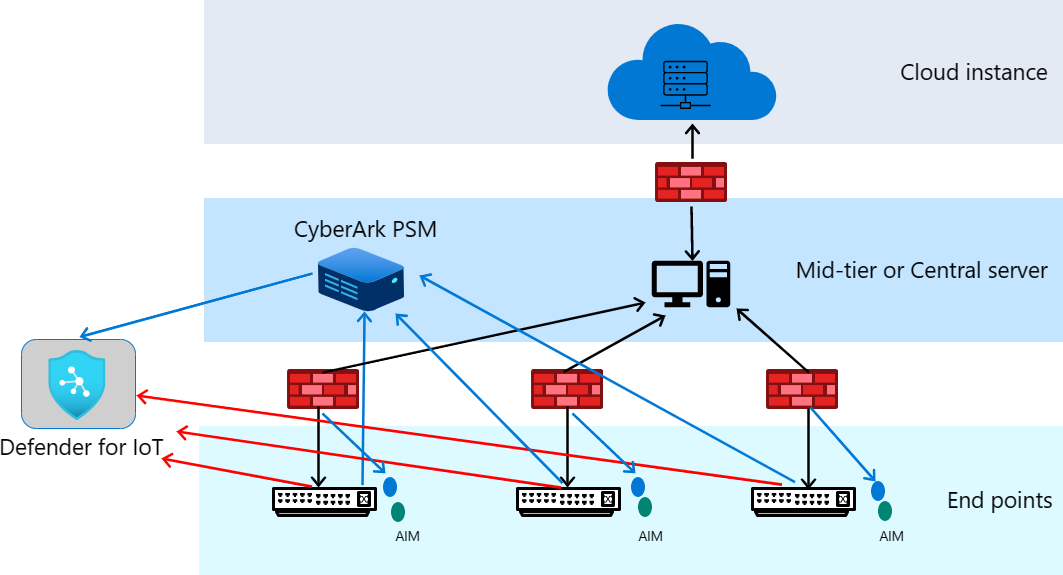
The Defender for IoT appliance is connected to the OT network via a SPAN port (mirror port) on network devices, such as switches and routers, via a one-way (inbound) connection to the dedicated network interfaces on the Defender for IoT appliance.
A dedicated network interface is also provided in the Defender for IoT appliance for centralized management and API access. This interface is also used for communicating with the CyberArk PSM solution that is deployed in the data center of the organization to manage privileged users and secure remote access connections.
In this article, you learn how to:
- Configure PSM in CyberArk
- Enable the integration in Defender for IoT
- View and manage detections
- Stop the integration
Prerequisites
Before you begin, make sure that you have the following prerequisites:
CyberARK version 2.0.
Verify that you have CLI access to all Defender for IoT appliances in your enterprise.
An Azure account. If you don't already have an Azure account, you can create your Azure free account today.
Access to a Defender for IoT OT sensor as an Admin user. For more information, see On-premises users and roles for OT monitoring with Defender for IoT.
Configure PSM CyberArk
CyberArk must be configured to allow communication with Defender for IoT. This communication is accomplished by configuring PSM.
To configure PSM:
Locate and open the
c:\Program Files\PrivateArk\Server\dbparam.xmlfile.Add the following parameters:
[SYSLOG]UseLegacySyslogFormat=YesSyslogTranslatorFile=Syslog\CyberX.xslSyslogServerIP=<CyberX Server IP>SyslogServerProtocol=UDPSyslogMessageCodeFilter=319,320,295,378,380Save the file, then close it.
Place the Defender for IoT syslog configuration file
CyberX.xslinc:\Program Files\PrivateArk\Server\Syslog\CyberX.xsl.Open the Server Central Administration.
Select the
 Stop Traffic Light to stop the server.
Select the Start Traffic Light to start the server.
Enable the integration in Defender for IoT
In order to enable the integration, Syslog Server needs to be enabled in the OT sensor. By default, the Syslog Server listens to the IP address of the system using port 514 UDP.
To configure Defender for IoT:
Sign into your OT sensor, then navigate to System Settings.
Toggle the Syslog Server to On.

(Optional) Change the port by signing into the system via the CLI, navigating to
/var/cyberx/properties/syslog.properties, and then changing tolistener: 514/udp.
View and manage detections
The integration between Microsoft Defender for IoT and CyberArk PSM is performed via syslog messages. These messages are sent by the PSM solution to Defender for IoT, notifying Defender for IoT of any remote sessions or verification failures.
Once the Defender for IoT platform receives these messages from PSM, it correlates them with the data it sees in the network. Thus, validating that any remote access connections to the network were generated by the PSM solution and not by an unauthorized user.
View alerts
Whenever the Defender for IoT platform identifies remote sessions that haven't been authorized by PSM, it issues an Unauthorized Remote Session. To facilitate immediate investigation, the alert also shows the IP addresses and names of the source and destination devices.
To view alerts:
Sign into your OT sensor, then select Alerts.
From the list of alerts, select the alert titled Unauthorized Remote Session.
Event timeline
Whenever PSM authorizes a remote connection, it's visible in the Defender for IoT Event Timeline page. The Event Timeline page shows a timeline of all alerts and notifications.
To view the event timeline:
Sign into your network sensor, then select Event timeline.
Locate any event titled PSM Remote Session.
Auditing & forensics
Administrators can audit and investigate remote access sessions by querying the Defender for IoT platform via its built-in data mining interface. This information can be used to identify all remote access connections that have occurred, including forensic details such as from or to devices, protocols (RDP, or SSH), source and destination users, time-stamps, and whether the sessions were authorized using PSM.
To audit and investigate:
Sign into your network sensor, then select Data mining.
Select Remote Access.
Stop the Integration
At any point in time, you can stop the integration from communicating.
To stop the integration:
In the OT sensor, navigate to System Settings.
Toggle the Syslog Server option to Off .

