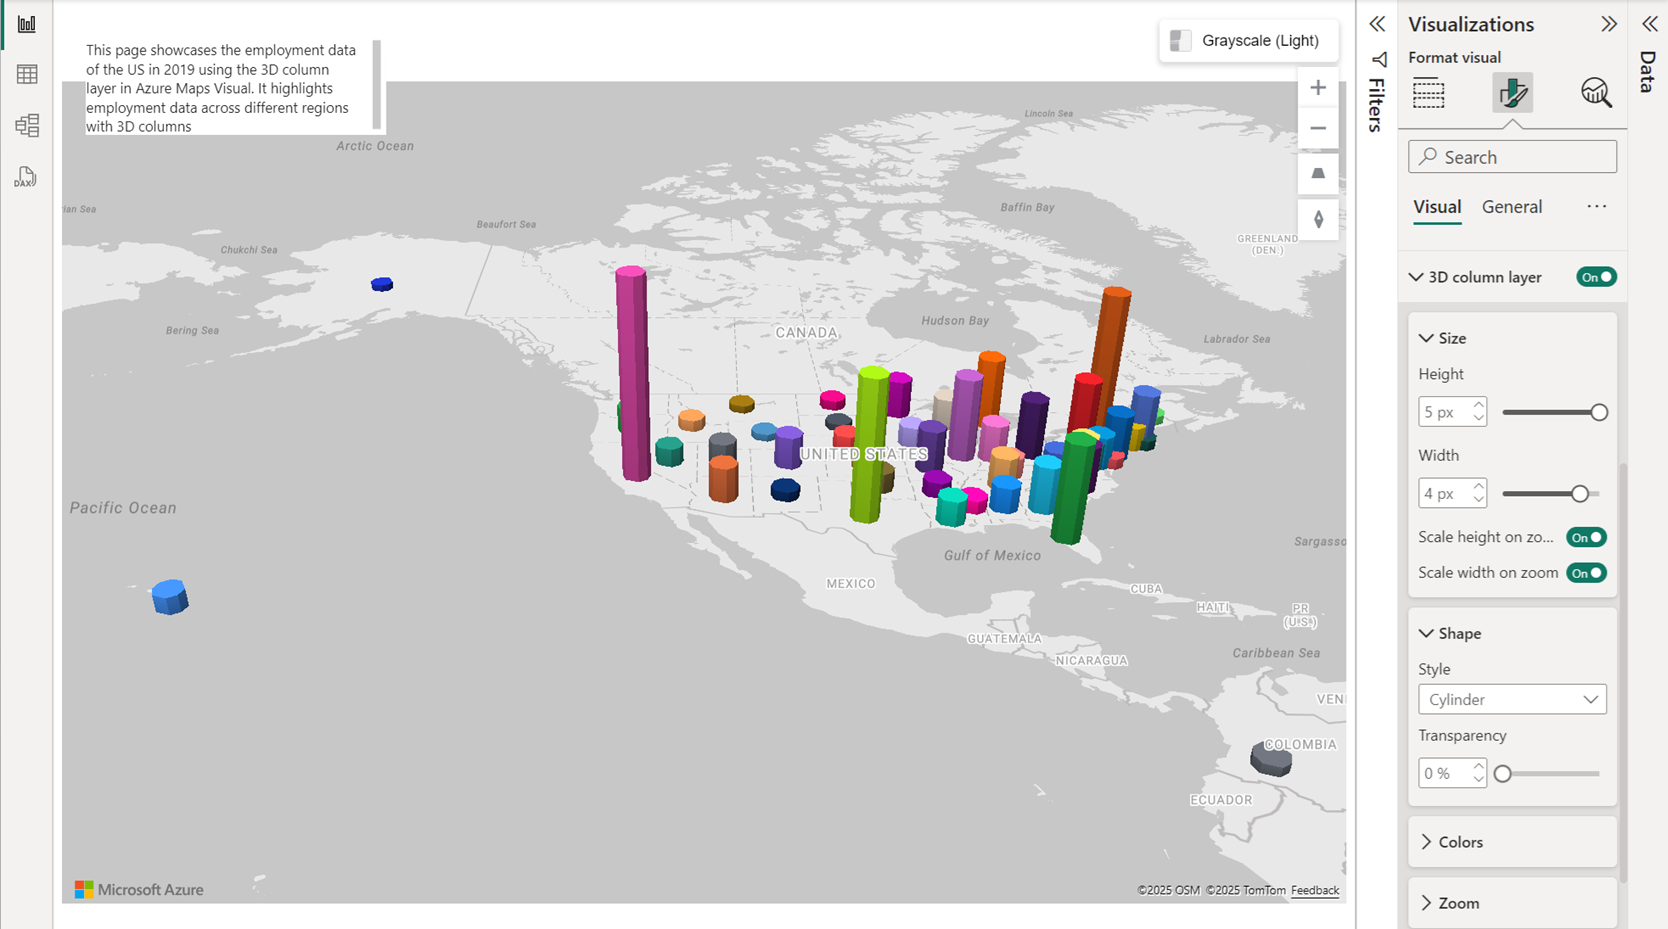
Add a 3D column layer
The 3D column layer is useful for taking data to the next dimension by allowing visualization of location data as 3D cylinders on the map. Similar to the bubble layer, the 3D column chart can easily visualize two metrics at the same time using color and relative height. In order for the columns to have height, a measure needs to be added to the Size bucket of the Fields pane. If a measure isn't provided, columns with no height show as flat squares or circles depending on the Shape option.
Users can tilt and rotate the map to view your data from different perspectives. The map can be tilted or pitched using one of the following methods.
- Turn on the Navigation controls option in the Map settings of the Format pane to add a button that tilts the map.
- Hold down the right mouse button and drag the mouse up or down.
- Using a touch screen, touch the map with two fingers and drag them up or down together.
- With the map focused, hold the Shift key, and press the Up or Down arrow keys.
The map can be rotated using one of the following methods.
- Turn on the Navigation controls option in the Map settings of the Format pane to add a button that rotates the map.
- Hold down the right mouse button and drag the mouse left or right.
- Using a touch screen, touch the map with two fingers and rotate.
- With the map focused, hold the Shift key, and press the Left or Right arrow keys.
The following are all settings in the Format pane that are available in the 3D column layer section.
| Setting | Description |
|---|---|
| Column shape | The shape of the 3D column. • Box – columns rendered as rectangular boxes. • Cylinder – columns rendered as cylinders. |
| Height | The height of each column. If a field is passed into the Size bucket of the Fields pane, columns are scaled relative to this height value. |
| Scale height on zoom | Specifies if the height of the columns should scale relative to the zoom level. |
| Width | The width of each column. |
| Scale width on zoom | Specifies if the width of the columns should scale relative to the zoom level. |
| Fill color | Color of each column. This option is hidden when a field is passed into the Legend bucket of the Fields pane and a separate Data colors section appears in the Format pane. |
| Transparency | Transparency of each column. |
| Min zoom | Minimum zoom level tiles are available. |
| Max zoom | Maximum zoom level tiles are available. |
| Layer position | Specifies the position of the layer relative to other map layers. |
Note
If the columns have a small width value and the Scale width on zoom option is disabled, they can disappear when zoomed out a lot as their rendered width would be less than a pixel in size. However, when the Scale width on zoom option is enabled, more calculations are performed when the zoom level changes which can affect performance of large data sets.
Next steps
Change how your data is displayed on the map:
Add more context to the map:
Customize the visual:
