Set up diagnostics for Azure Cloud Services and virtual machines
Applies to: ![]() Visual Studio
Visual Studio ![]() Visual Studio for Mac
Visual Studio for Mac
Note
This article applies to Visual Studio 2017. If you're looking for the latest Visual Studio documentation, see Visual Studio documentation. We recommend upgrading to the latest version of Visual Studio. Download it here
When you need to troubleshoot an Azure cloud service or virtual machine, you can use Visual Studio to more easily set up Azure Diagnostics. Diagnostics captures system data and logging data on the virtual machines and virtual machine instances that run your cloud service. Diagnostics data is transferred to a storage account that you choose. For more information about diagnostics logging in Azure, see Enable diagnostics logging for Web Apps in Azure App Service.
In this article, we show you how to use Visual Studio to turn on and set up Azure Diagnostics, both before and after deployment. Learn how to set up Diagnostics on Azure virtual machines, how to select the types of diagnostics information to collect, and how to view the information after it's collected.
You can use one of the following options to set up Azure Diagnostics:
- Change diagnostics settings in the Diagnostics Configuration dialog box in Visual Studio. The settings are saved in a file called diagnostics.wadcfgx (in Azure SDK 2.4 and earlier, the file is called diagnostics.wadcfg). You also you can directly modify the configuration file. If you manually update the file, the configuration changes take effect the next time you deploy the cloud service to Azure or run the service in the emulator.
- Use Cloud Explorer or Server Explorer in Visual Studio to change the diagnostics settings for a cloud service or virtual machine that is running.
Azure SDK 2.6 diagnostics changes
The following changes apply to Azure SDK 2.6 and later projects in Visual Studio:
- The local emulator now supports diagnostics. This means that you can collect diagnostics data and ensure that your application creates the right traces while you develop and test in Visual Studio. The connection string
UseDevelopmentStorage=trueturns on diagnostics data collection while you are running your cloud service project in Visual Studio by using the Azure Storage Emulator. All diagnostics data is collected in the Development Storage storage account. - The diagnostics storage account connection string
Microsoft.WindowsAzure.Plugins.Diagnostics.ConnectionStringis stored in the service configuration (.cscfg) file. In Azure SDK 2.5, the diagnostics storage account is specified in the diagnostics.wadcfgx file.
The connection string works differently in some key ways in Azure SDK 2.6 and later versus Azure SDK 2.4 and earlier:
- In Azure SDK 2.4 and earlier, the connection string is used as a runtime by the diagnostics plug-in to get the storage account information for transferring diagnostics logs.
- In Azure SDK 2.6 and later, Visual Studio uses the diagnostics connection string to set up the Azure Diagnostics Extension with the appropriate storage account information during publishing. You can use the connection string to define different storage accounts for different service configurations that Visual Studio uses during publishing. However, because the diagnostics plug-in is not available after Azure SDK 2.5, the .cscfg file by itself can't set up the diagnostics extension. You must set up the extension separately by using tools like Visual Studio or PowerShell.
- To simplify the process of setting up the diagnostics extension by using PowerShell, the package output from Visual Studio includes the public configuration XML for the diagnostics extension for each role. Visual Studio uses the diagnostics connection string to populate the storage account information in the public configuration. The public config files are created in the Extensions folder. The public config files use the naming pattern PaaSDiagnostics.<role name>.PubConfig.xml. Any PowerShell-based deployments can use this pattern to map each configuration to a role.
- The Azure portal uses the connection string in the .cscfg file to access the diagnostics data. The data appears on the Monitoring tab. The connection string is required to set the service to show verbose monitoring data in the portal.
Migrate projects to Azure SDK 2.6 and later
When you migrate from Azure SDK 2.5 to Azure SDK 2.6 or later, if you had a diagnostics storage account specified in the .wadcfgx file, the storage account stays in that file. To take advantage of the flexibility of using different storage accounts for different storage configurations, manually add the connection string to your project. If you're migrating a project from Azure SDK 2.4 or earlier to Azure SDK 2.6, the diagnostics connection strings are preserved. However, note the changes in how connection strings are treated in Azure SDK 2.6, described in the preceding section.
How Visual Studio determines the diagnostics storage account
- If a diagnostics connection string is specified in the .cscfg file, Visual Studio uses it to set up the diagnostics extension during publishing and when it generates the public configuration XML files during packaging.
- If a diagnostics connection string is not specified in the .cscfg file, Visual Studio falls back to using the storage account that's specified in the .wadcfgx file to set up the diagnostics extension for publishing and for generating the public configuration XML files during packaging.
- The diagnostics connection string in the .cscfg file takes precedence over the storage account in the .wadcfgx file. If a diagnostics connection string is specified in the .cscfg file, Visual Studio uses that connection string and ignores the storage account in .wadcfgx.
What does the "Update development storage connection strings..." check box do?
The Update development storage connection strings for Diagnostics and Caching with Microsoft Azure storage account credentials when publishing to Microsoft Azure check box is a convenient way to update any development storage account connection strings with the Azure storage account that you specify during publishing.
For example, if you select this check box and the diagnostics connection string specifies UseDevelopmentStorage=true, when you publish the project to Azure, Visual Studio automatically updates the diagnostics connection string with the storage account that you specified in the Publish wizard. However, if a real storage account was specified as the diagnostics connection string, that account is used instead.
Diagnostics functionality differences in Azure SDK 2.4 and earlier vs. Azure SDK 2.5 and later
If you're upgrading your project from Azure SDK 2.4 and earlier to Azure SDK 2.5 or later, keep in mind the following diagnostics functionality differences:
- Configuration APIs are deprecated. Programmatic configuration of diagnostics is available in Azure SDK 2.4 and earlier, but is deprecated in Azure SDK 2.5 and later. If your diagnostics configuration currently is defined in code, you must reconfigure those settings from scratch in the migrated project for diagnostics to keep working. The diagnostics configuration file for Azure SDK 2.4 is diagnostics.wadcfg. The diagnostics configuration file for Azure SDK 2.5 and later is diagnostics.wadcfgx.
- Diagnostics for cloud service applications can be configured only at the role level. In Azure SDK 2.5 and later, you can't set up diagnostics for cloud service applications at the instance level.
- Every time you deploy your app, the diagnostics configuration is updated. This can cause parity issues if you change your diagnostics configuration from Visual Studio Server Explorer and then redeploy your app.
- In Azure SDK 2.5 and later, crash dumps are configured in the diagnostics configuration file, and not in code. If you have crash dumps configured in code, you must manually transfer the configuration from code to the configuration file. Crash dumps aren't transferred during the migration to Azure SDK 2.6.
Turn on diagnostics in cloud service projects before you deploy them
In Visual Studio, you can collect diagnostics data for roles that run in Azure when you run the service in the emulator before deployment. All changes to diagnostics settings in Visual Studio are saved in the diagnostics.wadcfgx configuration file. These settings specify the storage account where diagnostics data is saved when you deploy your cloud service.
Warning
When you enable diagnostics for an existing role, any extensions that you have already set are disabled when the package is deployed. These include:
- Microsoft Monitoring Agent Diagnostics
- Microsoft Azure Security Monitoring
- Microsoft Antimalware
- Microsoft Monitoring Agent
- Microsoft Service Profiler Agent
- Windows Azure Domain Extension
- Windows Azure Diagnostics Extension
- Windows Azure Remote Desktop Extension
- Windows Azure Log Collector
You can reset your extensions via the Azure portal or PowerShell after you deploy the updated role.
To turn on diagnostics in Visual Studio before deployment
On the shortcut menu for the role, select Properties. In the role’s Properties dialog box, select the Configuration tab.
In the Diagnostics section, make sure that the Enable Diagnostics check box is selected.
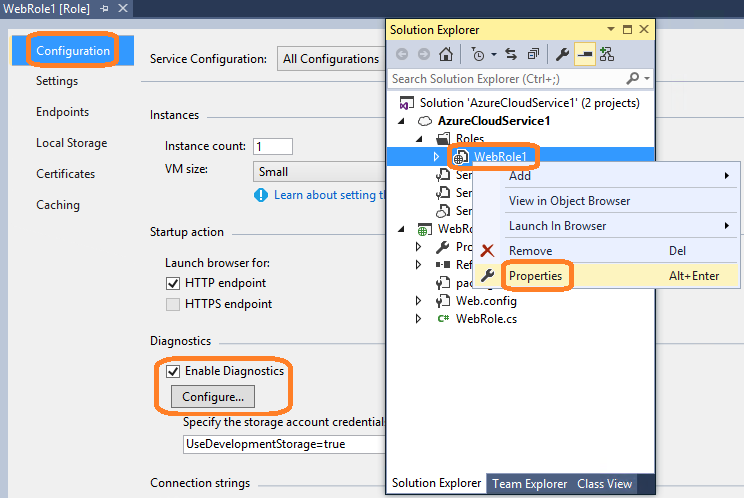
To specify the storage account for the diagnostics data, select the ellipsis (…) button.

In the Create Storage Connection String dialog box, specify whether you want to connect by using the Azure Storage Emulator, an Azure subscription, or manually entered credentials.
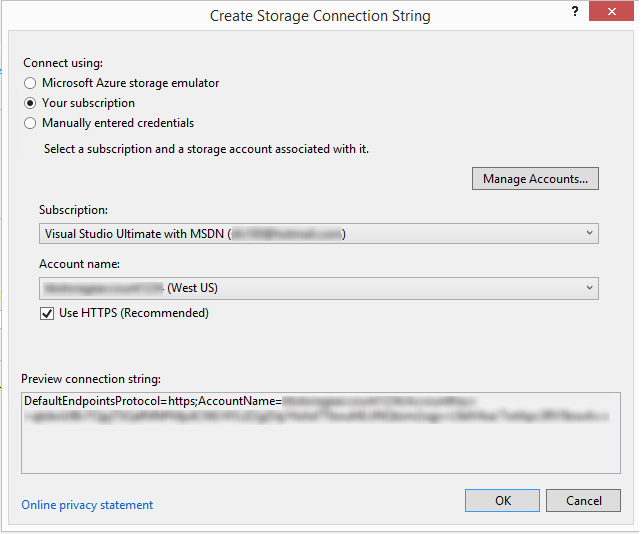
- If you select Microsoft Azure Storage Emulator, the connection string is set to
UseDevelopmentStorage=true. - If you select Your subscription, you can select the Azure subscription that you want to use, and enter an account name. To manage your Azure subscriptions, select Manage Accounts.
- If you select Manually entered credentials, enter the name and key of the Azure account that you want to use.
- If you select Microsoft Azure Storage Emulator, the connection string is set to
To view the Diagnostics configuration dialog box, select Configure. Except for General and Log Directories, each tab represents a diagnostics data source that you can collect. The default General tab offers the following diagnostics data collection options: Errors only, All information, and Custom plan. The default Errors only option uses the least amount of storage, because it doesn’t transfer warnings or tracing messages. The All information option transfers the most information, uses the most storage, and therefore, is the most expensive option.
Note
Minimum supported size for “Disk Quota in MB” is 50MB, and the default size is 4GB. However, if you are collecting Memory dumps, increase this to a higher value like 10GB.
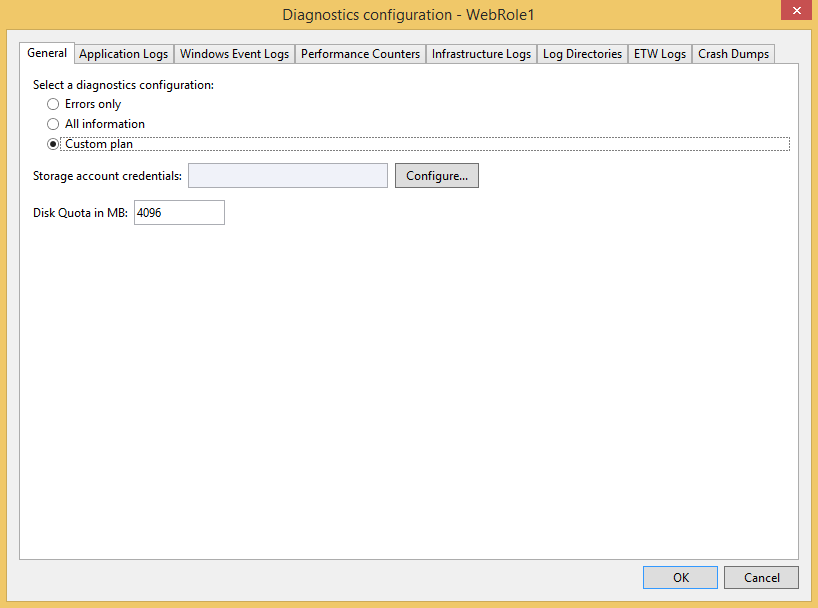
For this example, select the Custom plan option, so you can customize the collected data.
In the Disk Quota in MB box, you can set how much space to allocate in your storage account for diagnostics data. You can change or accept the default value.
On each tab of diagnostics data that you want to collect, select the Enable Transfer of <log type> check box. For example, if you want to collect application logs, on the Application Logs tab, select the Enable transfer of Application Logs check box. Also, specify any other information that's required by each diagnostics data type. For configuration information for each tab, see the section Set up diagnostics data sources later in this article.
After you’ve enabled collection of all the diagnostics data you want, select OK.
Run your Azure cloud service project in Visual Studio as usual. As you use your application, the log information that you enabled is saved to the Azure storage account that you specified.
Turn on diagnostics on Azure virtual machines
In Visual Studio, you can collect diagnostics data for Azure virtual machines.
To turn on diagnostics on Azure virtual machines
In Server Explorer, select the Azure node, and then connect to your Azure subscription, if you're not already connected.
Expand the Virtual Machines node. You can create a new virtual machine, or select an existing node.
On the shortcut menu for the virtual machine you want, select Configure. The virtual machine configuration dialog box appears.
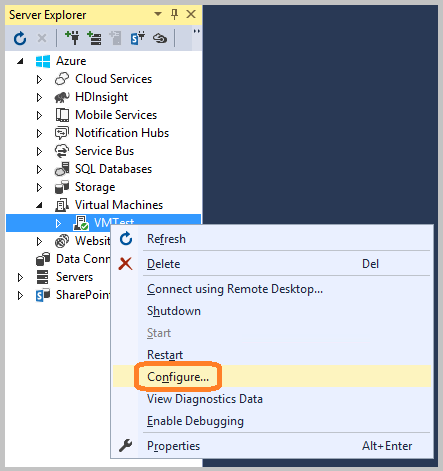
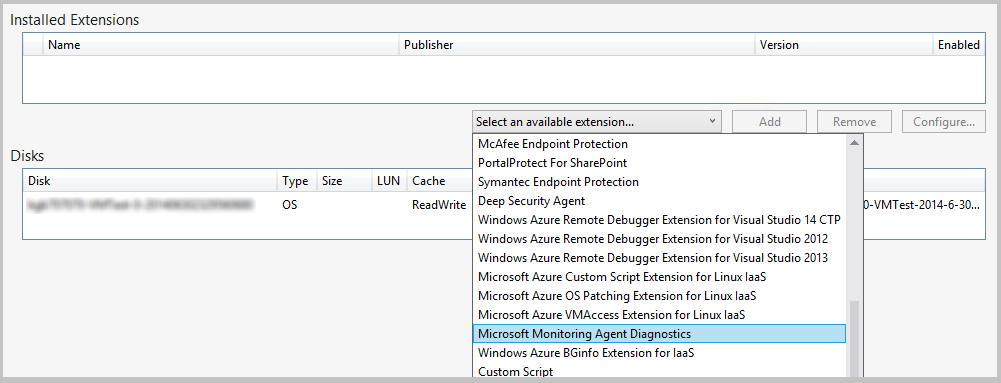
If it's not already installed, add the Microsoft Monitoring Agent Diagnostics extension. With this extension, you can gather diagnostics data for the Azure virtual machine. Under Installed Extensions, in the Select an available extension drop-down list box, select Microsoft Monitoring Agent Diagnostics.
Note
Other diagnostics extensions are available for your virtual machines. For more information, see Virtual machine extensions and features for Windows.
To add the extension and view its Diagnostics configuration dialog box, select Add.
To specify a storage account, select Configure, and then select OK.
Each tab (except for General and Log Directories) represents a diagnostics data source that you can collect.

The default tab, General, offers you the following diagnostics data collection options: Errors only, All information, and Custom plan. The default option, Errors only, takes the least amount of storage because it doesn’t transfer warnings or tracing messages. The All information option transfers the most information and is, therefore, the most expensive option in terms of storage.
For this example, select the Custom plan option so you can customize the data collected.
The Disk Quota in MB box specifies how much space you want to allocate in your storage account for diagnostics data. You can change the default value if you want.
On each tab of diagnostics data you want to collect, select its Enable Transfer of <log type> check box.
For example, if you want to collect application logs, select the Enable transfer of Application Logs check box on the Application Logs tab. Also, specify any other information that's required for each diagnostics data type. For configuration information for each tab, see the section Set up diagnostics data sources later in this article.
After you’ve enabled collection of all the diagnostics data that you want, select OK.
Save the updated project.
A message in the Microsoft Azure Activity Log window indicates that the virtual machine has been updated.
Set up diagnostics data sources
After you enable diagnostics data collection, you can choose exactly what data sources you want to collect, and what information is collected. The next sections describe the tabs in the Diagnostics configuration dialog box and what each configuration option means.
Application logs
Application logs have diagnostics information that's produced by a web application. If you want to capture application logs, select the Enable transfer of Application Logs check box. To increase or decrease the interval between the transfer of application logs to your storage account, change the Transfer Period (min) value. You also can change the amount of information captured in the log by setting the Log level value. For example, select Verbose to get more information, or select Critical to capture only critical errors. If you have a specific diagnostics provider that emits application logs, you can capture the logs by adding the provider’s GUID in the Provider GUID box.

For more information about application logs, see Enable diagnostics logging for Web Apps in Azure App Service.
Windows event logs
To capture Windows event logs, select the Enable transfer of Windows Event Logs check box. To increase or decrease the interval between the transfer of event logs to your storage account, change the Transfer Period (min) value. Select the check boxes for the types of events that you want to track.
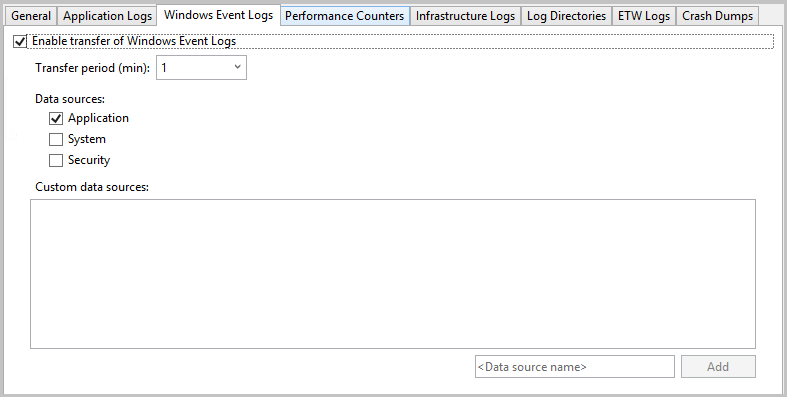
If you're using Azure SDK 2.6 or later and you want to specify a custom data source, enter it in the <Data source name> text box, and then select Add. The data source is added to the diagnostics.cfcfg file.
If you're using Azure SDK 2.5 and want to specify a custom data source, you can add it to the WindowsEventLog section of the diagnostics.wadcfgx file, like in the following example:
<WindowsEventLog scheduledTransferPeriod="PT1M">
   <DataSource name="Application!*" />
   <DataSource name="CustomDataSource!*" />
</WindowsEventLog>
Performance counters
Performance counter information can help you locate system bottlenecks and fine-tune system and application performance. For more information, see Create and use performance counters in an Azure application. To capture performance counters, select the Enable transfer of Performance Counters check box. To increase or decrease the interval between the transfer of event logs to your storage account, change the Transfer Period (min) value. Select the check boxes for the performance counters that you want to track.
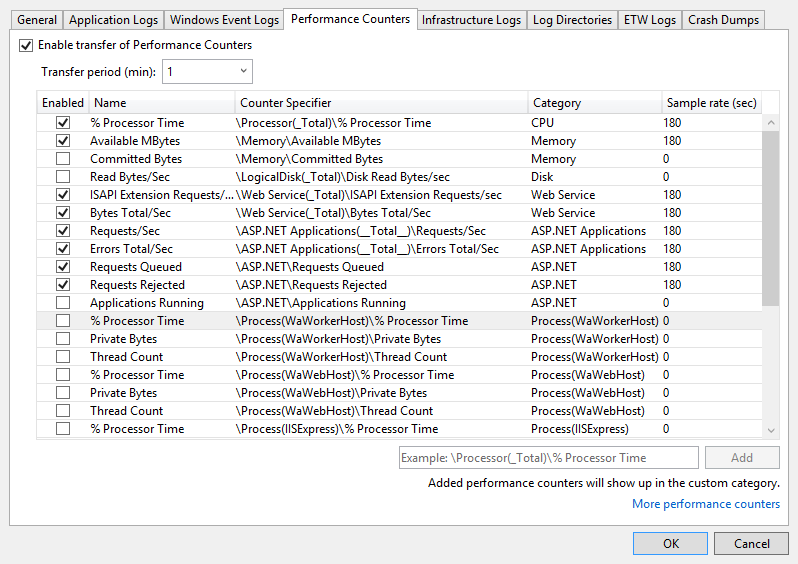
To track a performance counter that isn’t listed, enter the performance counter by using the suggested syntax. and then select Add. The operating system on the virtual machine determines which performance counters you can track. For more information about syntax, see Specify a counter path.
Infrastructure logs
Infrastructure logs have information about the Azure diagnostic infrastructure, the RemoteAccess module, and the RemoteForwarder module. To collect information about infrastructure logs, select the Enable transfer of Infrastructure Logs check box. To increase or decrease the interval between the transfer of infrastructure logs to your storage account, change the Transfer Period (min) value.

For more information, see Collect logging data by using Azure Diagnostics.
Log directories
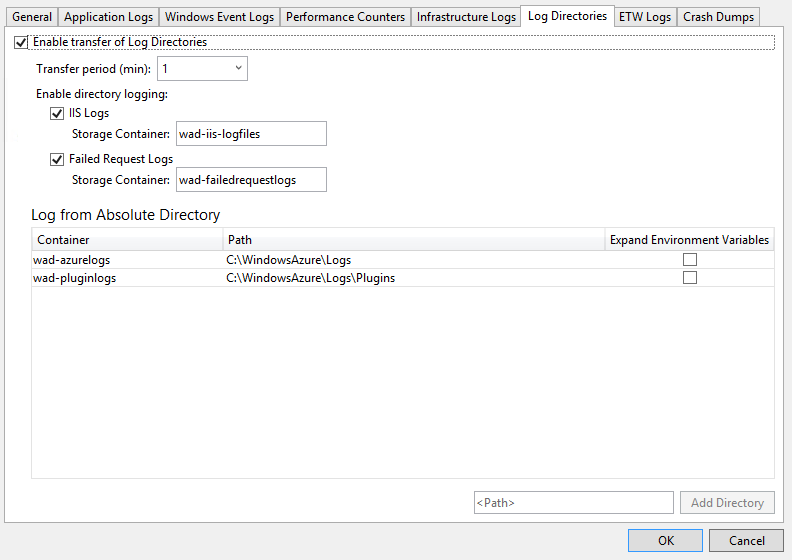
Log directories have data collected from log directories for Internet Information Services (IIS) requests, failed requests, or folders that you choose. To capture log directories, select the Enable transfer of Log Directories check box. To increase or decrease the interval between the transfer of logs to your storage account, change the Transfer Period (min) value.
Select the check boxes of the logs that you want to collect, such as IIS Logs and Failed Request logs. Default storage container names are provided, but you can change the names.
You can capture logs from any folder. Specify the path in the Log from Absolute Directory section, and then select Add Directory. The logs are captured in the specified containers.
ETW logs
If you use Event Tracing for Windows (ETW) and want to capture ETW logs, select the Enable transfer of ETW Logs check box. To increase or decrease the interval between the transfer of logs to your storage account, change the Transfer Period (min) value.
The events are captured from event sources and event manifests that you specify. To specify an event source, in the Event Sources section, enter a name and then select Add Event Source. Similarly, you can specify an event manifest in the Event Manifests section, and then select Add Event Manifest.
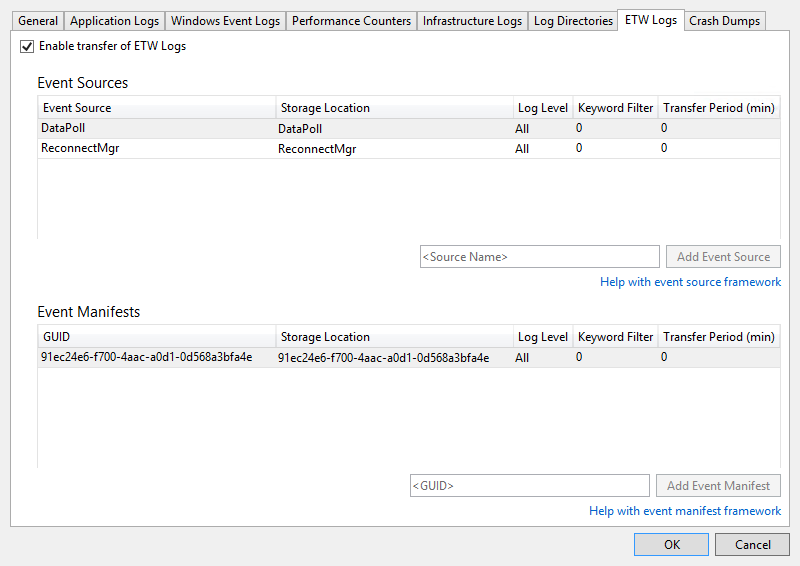
The ETW framework is supported in ASP.NET through classes in the System.Diagnostics.aspx namespace. The Microsoft.WindowsAzure.Diagnostics namespace, which inherits from and extends standard System.Diagnostics.aspx classes, enables the use of System.Diagnostics.aspx as a logging framework in the Azure environment. For more information, see Take control of logging and tracing in Microsoft Azure and Enable diagnostics in Azure Cloud Services and virtual machines.
Crash dumps
To capture information about when a role instance crashes, select the Enable transfer of Crash Dumps check box. (Because ASP.NET handles most exceptions, this is generally useful only for worker roles.) To increase or decrease the percentage of storage space devoted to the crash dumps, change the Directory Quota (%) value. You can change the storage container where the crash dumps are stored, and select whether you want to capture a Full or Mini dump.
The processes currently being tracked are listed in the next screenshot. Select the check boxes for the processes that you want to capture. To add another process to the list, enter the process name and then select Add Process.
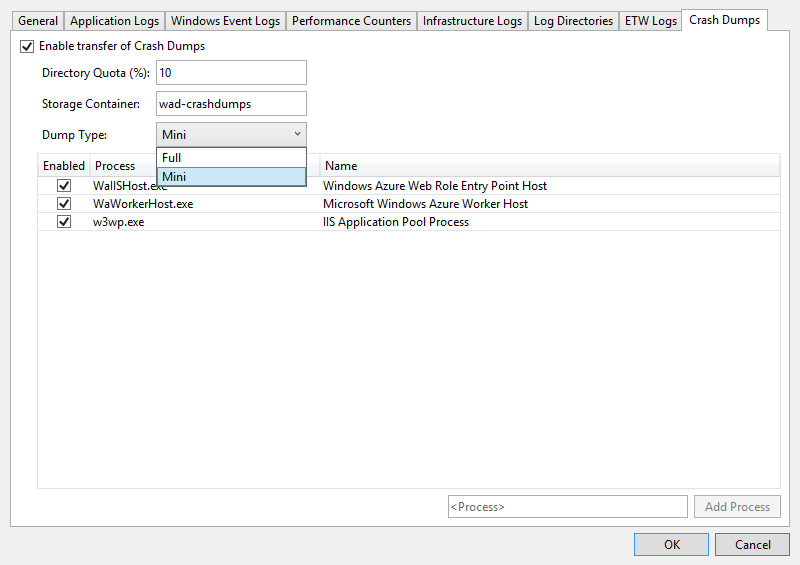
For more information, see Take control of logging and tracing in Microsoft Azure and Microsoft Azure Diagnostics Part 4: Custom logging components and Azure Diagnostics 1.3 changes.
View the diagnostics data
After you’ve collected the diagnostics data for a cloud service or virtual machine, you can view it.
To view cloud service diagnostics data
Deploy your cloud service as usual, and then run it.
You can view the diagnostics data either in a report that Visual Studio generates, or in tables in your storage account. To view the data in a report, open Cloud Explorer or Server Explorer, open the shortcut menu of the node for the role that you want, and then select View Diagnostic Data.
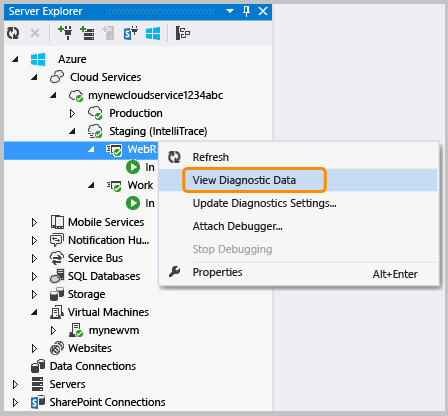
A report that shows the available data appears.

If the most recent data isn't shown, you might have to wait for the transfer period to elapse.
To immediately update the data, select the Refresh link. To have the data updated automatically, select an interval in the Auto-Refresh drop-down list box. To export the error data, select the Export to CSV button to create a comma-separated value file that you can open in an Excel worksheet.
In Cloud Explorer or Server Explorer, open the storage account that's associated with the deployment.
Open the diagnostics tables in the table viewer, and then review the data that you collected. For IIS logs and custom logs, you can open a blob container. The following table lists the tables or blob containers that contain the data for the different log files. In addition to the data for that log file, the table entries contain EventTickCount, DeploymentId, Role, and RoleInstance, to help you identify which virtual machine and role generated the data, and when.
Diagnostic data Description Location Application logs Logs that your code generates by calling methods of the System.Diagnostics.Trace class. WADLogsTable Event logs Data from the Windows event logs on the virtual machines. Windows stores information in these logs, but applications and services also use the logs to report errors or log information. WADWindowsEventLogsTable Performance counters You can collect data on any performance counter that’s available on the virtual machine. The operating system provides performance counters, which include many statistics, like memory usage and processor time. WADPerformanceCountersTable Infrastructure logs Logs that are generated from the diagnostics infrastructure itself. WADDiagnosticInfrastructureLogsTable IIS logs Logs that record web requests. If your cloud service gets a significant amount of traffic, these logs can be lengthy. It's a good idea to collect and store this data only when you need it. You can find failed-request logs in the blob container under wad-iis-failedreqlogs, under a path for that deployment, role, and instance. You can find complete logs under wad-iis-logfiles. Entries for each file are made in the WADDirectories table. Crash dumps Provides binary images of your cloud service’s process (typically a worker role). wad-crush-dumps blob container Custom log files Logs of data that you predefined. You can specify in code the location of custom log files in your storage account. For example, you can specify a custom blob container. If data of any type is truncated, you can try increasing the buffer for that data type or shortening the interval between transfers of data from the virtual machine to your storage account.
(Optional) Purge data from the storage account occasionally to reduce overall storage costs.
When you do a full deployment, the diagnostics.cscfg file (.wadcfgx for Azure SDK 2.5) is updated in Azure, and your cloud service picks up any changes to your diagnostics configuration. If you instead update an existing deployment, the .cscfg file isn’t updated in Azure. You can still change diagnostics settings, though, by following the steps in the next section. For more information about performing a full deployment and updating an existing deployment, see Publish Azure Application Wizard.
To view virtual machine diagnostics data
On the shortcut menu for the virtual machine, select View Diagnostics Data.
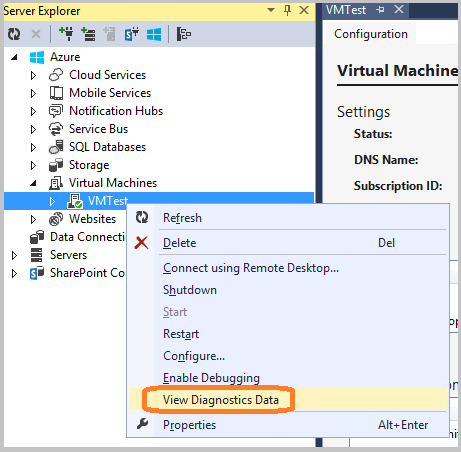
The Diagnostics summary dialog box appears.
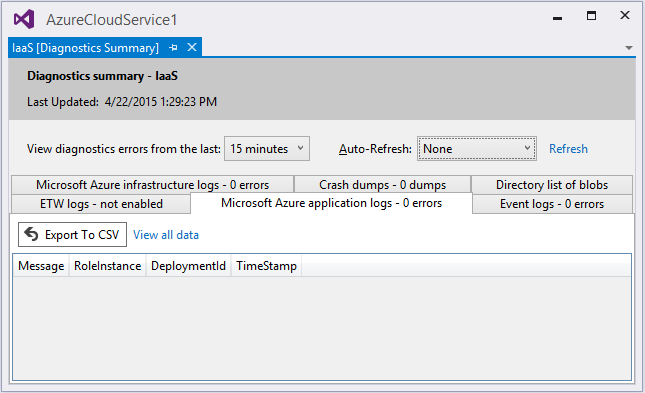
If the most recent data isn't shown, you might have to wait for the transfer period to elapse.
To immediately update the data, select the Refresh link. To have the data updated automatically, select an interval in the Auto-Refresh drop-down list box. To export the error data, select the Export to CSV button to create a comma-separated value file that you can open in an Excel worksheet.
Set up cloud service diagnostics after deployment
If you're investigating a problem with a cloud service that is already running, you might want to collect data that you didn't specify before you originally deployed the role. In this case, you can start collecting that data by changing the settings in Server Explorer. You can set up diagnostics either for a single instance or for all the instances in a role, depending on whether you open the Diagnostics Configuration dialog box from the shortcut menu for the instance or for the role. If you configure the role node, any changes that you make apply to all instances. If you configure the instance node, any changes that you make apply only to that instance.
To set up diagnostics for a running cloud service
In Server Explorer, expand the Cloud Services node, and then expand the list of nodes to locate the role or instance (or both) that you want to investigate.
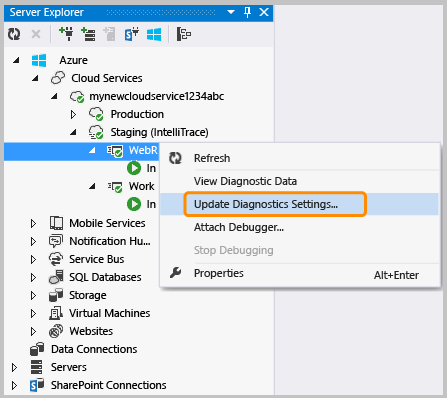
On the shortcut menu for an instance node or role node, select Update Diagnostics Settings, and then select the diagnostic settings that you want to collect.
For information about the configuration settings, see the section Set up diagnostics data sources in this article. For information about how to view the diagnostics data, see the section View the diagnostics data in this article.
If you change data collection in Server Explorer, the changes remain in effect until you fully redeploy your cloud service. If you use the default publish settings, the changes are not overwritten. The default publish setting is to update the existing deployment, rather than to do a full redeployment. To ensure that the settings clear at deployment time, go to the Advanced Settings tab in the Publish wizard, and then clear the Deployment update check box. When you redeploy with that check box cleared, the settings revert to those in the .wadcfgx (or .wadcfg) file as set through the Properties editor for the role. If you update your deployment, Azure keeps the earlier settings.
Troubleshoot Azure cloud service issues
If you experience problems with your cloud service projects, like a role that gets stuck in a "busy" status, repeatedly recycles, or throws an internal server error, there are tools and techniques that you can use to diagnose and fix the issue. For specific examples of common problems and solutions, and for an overview of the concepts and tools that you can use to diagnose and fix these errors, see Azure PaaS compute diagnostics data.
Q & A
What is the buffer size, and how large should it be?
On each virtual machine instance, quotas limit how much diagnostics data can be stored on the local file system. In addition, you specify a buffer size for each type of diagnostics data that's available. This buffer size acts like an individual quota for that type of data. To determine the overall quota and the amount of memory that remains, see the bottom of the dialog box for the diagnostics data type. If you specify larger buffers or more types of data, you'll approach the overall quota. You can change the overall quota by modifying the diagnostics.wadcfg or .wadcfgx configuration file. The diagnostics data is stored on the same file system as your application’s data. If your application uses a large amount of disk space, you shouldn’t increase the overall diagnostics quota.
What is the transfer period, and how long should it be?
The transfer period is the amount of time that elapses between data captures. After each transfer period, data is moved from the local file system on a virtual machine to tables in your storage account. If the amount of data that's collected exceeds the quota before the end of a transfer period, older data is discarded. If you are losing data because your data exceeds the buffer size or the overall quota, you might want to decrease the transfer period.
What time zone are the time stamps in?
Time stamps are in the local time zone of the datacenter that hosts your cloud service. The following three time stamp columns in the log tables are used:
- PreciseTimeStamp: The ETW timestamp of the event. That is, the time the event is logged from the client.
- TIMESTAMP: The value for PreciseTimeStamp rounded down to the upload frequency boundary. For example, if your upload frequency is 5 minutes and the event time 00:17:12, TIMESTAMP is 00:15:00.
- Timestamp: The time stamp at which the entity was created in the Azure table.
How do I manage costs when collecting diagnostic information?
The default settings (Log level set to Error, and Transfer period set to 1 minute) are designed to minimize costs. Your compute costs increase when you collect more diagnostics data or if you decrease the transfer period. Don’t collect more data than you need, and don’t forget to disable data collection when you no longer need it. You can always enable it again, even at run time, as described earlier in this article.
How do I collect failed-request logs from IIS?
By default, IIS doesn’t collect failed-request logs. You can set up IIS to collect failed-request logs by editing the web.config file for your web role.
I’m not getting trace information from RoleEntryPoint methods like OnStart. What’s wrong?
The methods of RoleEntryPoint are called in the context of WAIISHost.exe, not in IIS. The configuration information in web.config that normally enables tracing doesn’t apply. To resolve this issue, add a .config file to your web role project, and name the file to match the output assembly that contains the RoleEntryPoint code. In the default web role project, the name of the .config file should be WAIISHost.exe.config. Add the following lines to this file:
<system.diagnostics>
  <trace>
      <listeners>
          <add name “AzureDiagnostics” type=”Microsoft.WindowsAzure.Diagnostics.DiagnosticMonitorTraceListener”>
              <filter type=”” />
          </add>
      </listeners>
  </trace>
</system.diagnostics>
In the Properties window, set the Copy to Output Directory property to Copy always.
Next steps
To learn more about diagnostics logging in Azure, see Enable diagnostics in Azure Cloud Services and virtual machines and Enable diagnostics logging for Web Apps in Azure App Service.